Graphic Validation
Now that you have completed your model, you can watch the build by build variation of the model.
•Click ![]() Nominal Build.
Nominal Build.
•Click ![]() Deviate.
Deviate.
In the assembled position, you can see the part variation changing the positions of the parts from build to build.
•Click [Close] in the Deviate dialog.
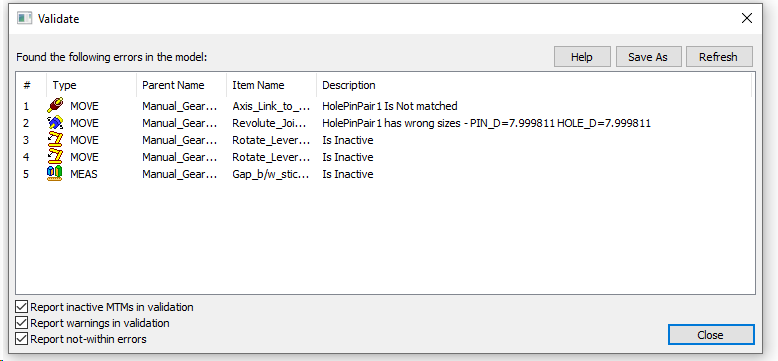
Validate Tool
The Validate Model function checks for errors in the Moves, Measures, and Tolerances in the assembly tree. The validation function can be used before and after running the analysis.
•Click ![]() Validate Model from the 3DCS Tools toolbar.
Validate Model from the 3DCS Tools toolbar.
•The Validate dialog will be displayed on screen
•Double click on any issues listed that need to be fixed.
DOF Counter
Select the ![]() DOF Counter from the Mechanical Add-Ons Toolbar. This displays all the mechanical moves of this model and their available Degrees of Freedom. Through this feature, the user can understand both the number of Degrees of Freedom restrained or dropped on each part, and the nominal build position after each move.
DOF Counter from the Mechanical Add-Ons Toolbar. This displays all the mechanical moves of this model and their available Degrees of Freedom. Through this feature, the user can understand both the number of Degrees of Freedom restrained or dropped on each part, and the nominal build position after each move.
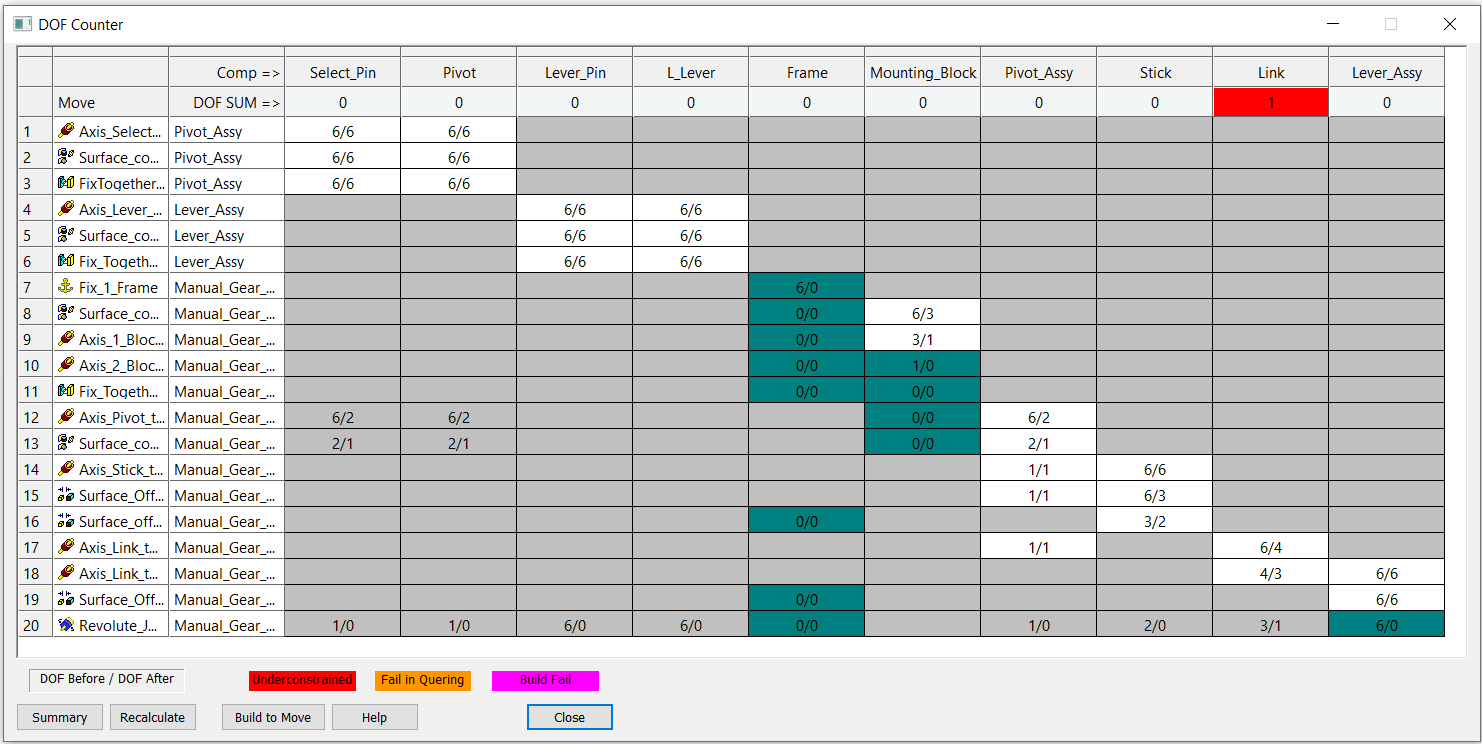
•The top most row in the dialog lists all the parts in the model.
•The numbers right below that will display the total degrees of freedom left for each part.
•The left most column will display all the moves in the model
•The corresponding rows of each move will display the DOF number. This shows how each move affects the part's DOF number.
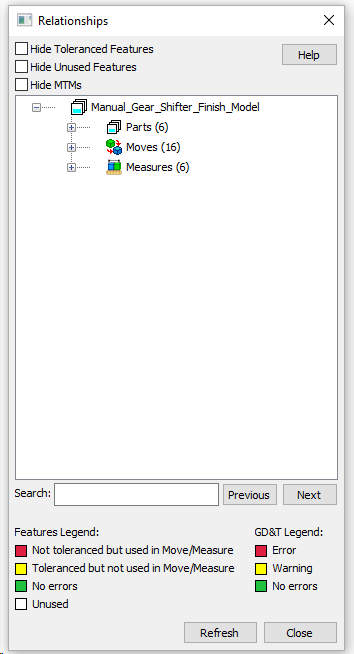
Relationship Tree
Another way to verify that all features important to our model are accounted for is to check them using the ![]() Relationships tool (typically located under
Relationships tool (typically located under ![]() Validate).
Validate).
•Select ![]() Relationships from the Tools toolbar to open up the Relationships dialog.
Relationships from the Tools toolbar to open up the Relationships dialog.
This will help the user to find out what features are used in the Moves/ Measures but were not toleranced, also to find any errors in GD&T creation.
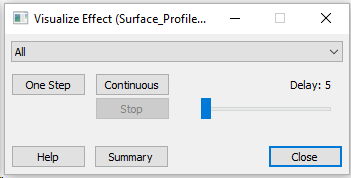
Visualize Effect
Visualize Effect is a tool that allows users to graphically see the impact of a single tolerance or float in the model. One input at a time is deviated to high, median, and low sequentially in the model. When the model is in its built position this represents a graphical visualization of how individual tolerances or floats translate through the model. It is meant as a tool for the user to better understand the contribution of a specific tolerance or float that they may be surprised to see (or not see) in the results provided by the 3DCS Contributor Analysis.
•Open the Position GD&T on the Frame
• Click [Visualize Effect].
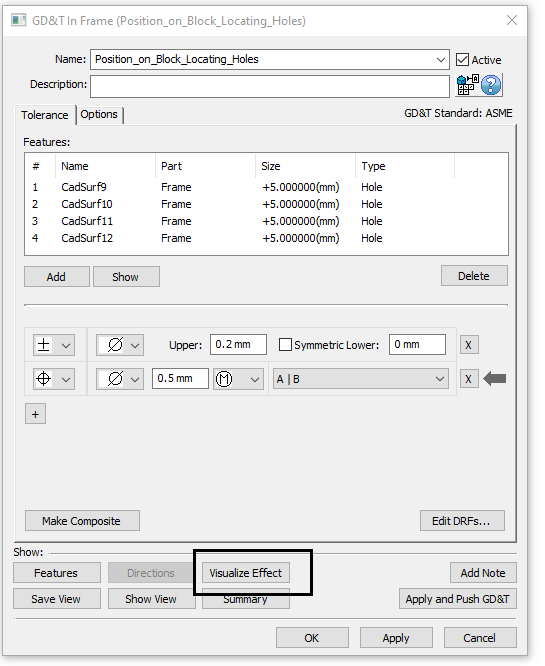
The dialog will list all the features toleranced in the GD&T, from which the user can select one and see the effect of that tolerance on that particular feature.
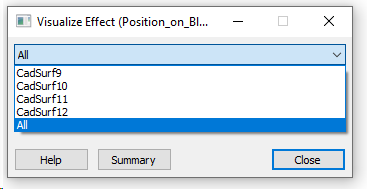
This option is also available in the analysis summary page to check the effect of each individual contributor.