•Options: Opens a dialog box that allows you to specify Measurement Precision, Range Precision, Factor Precision, Tolerance Range Plus/Minus, Tolerance Cost Factor, and Measure SigmaNum (+/-) values.
•Show Measure: Shows the contributing points/features in the selected measurement on the parts (in the window.)
•Show Tolerance: Shows the contributing points/features in the selected tolerance on the parts (in the window.)
•Apply Ranges toTolerances: Pushes the altered tolerances back into the current 3DCS model. Please note this function cannot be undone.
•GeoFactor Table: Opens a GeoFactor table. Measurements can be selected at the top drop-down list. Click [Edit Meas] to open the measure dialog. Click [Edit Contributor] after selecting a tolerance to open its dialog.
•Legend: Allows you to color code the matrix values. It aids in understanding the effect of tolerances on multiple measurements at once. If you have a tolerance with coefficients/percent contributions that show up red in multiple measurements then the tolerance is probably critical (verify with CTI.). The Factor Value default settings are 0.5, 1.0, and 1.5. The Contribution % default settings are lowest 10% = Blue, lower 40% = Green, higher 40% = Yellow, and highest 10% = Red.
•Show Contributor Per Point: Displays the individual GeoFactor coefficient for each point/feature in the given tolerance. The benefit of this mode is to highlight the individual point/feature with a high coefficient/contribution within the given tolerance.
•Show Contributor Per Tolerance Combines all the individual point/feature GeoFactor coefficients of the given tolerance by a RSS. The benefit of this mode is to observe the combined effect of that tolerance while minimizing the rows in the Analyzer Matrix.
•Factor Value: Displays the numeric value of the G Factor.
•Percentage: Displays the percent contribution to the 6-Sigma range.
•Filter: Allows insignificant contributors to be filtered out of the Analyzer Matrix.
❖ 1.2 DCS Tolerance Optimizer Definitions
•Current 6-Sigma: The measurement values of the model calculated from the current tolerance ranges and the GeoFactor Analyzer.
•6-Sigma (Max/Min Range): The highest and lowest possible measurement ranges. They are calculated by setting the tolerances to their max and min ranges as defined in the Tolerance section.
•Optimized 6-Sigma: The measurement value calculated from the optimized tolerance ranges and the GeoFactor Analyzer (optimized measures.)
•Target 6-Sigma: The desired variation for the particular measurement. The optimizer defaults to the Spec Limits defined in each measure of the model if possible.
•Current Range: The current tolerance values in the model.
•Optimized Range: The tolerance values after optimization occurs (optimized tolerances.)
•Max/Min Possible Range: Allows the user to define the ranges that tolerances can have when optimized. The Min/Max tolerance ranges are by default +/- 0.5 from the current tolerance ranges. For example, if a surface tolerance in the model is 4 mm (+/-2 mm) then the Max and Min tolerance ranges in the optimizer will be 4.5 mm and 3.5 mm.
•Lock Range: Checkbox allowing the user to lock a tolerance range at its Current Range value. The tolerance range will not be changed (optimized.)
•Cost Factor: Cost can be either relative or the actual cost of adjusting the given tolerance (cost per unit change.) See the equations below.
•Show Measure: Shows the contributing points/features in the selected measurement on the parts (in the window.)
•Show Tolerance: Shows the contributing points/features in the selected tolerance on the parts (in the window.)
•Current Effort: The relative or actual cost of the entire model based on the Current Range values, Max Possible Range values, and Cost Factor values.
•Optimized Effort: The relative or actual cost of the entire model based on the Current Range values, Max Possible Range values, and Cost Factor values.
•Optimize: Adjusts tolerances and measure results within the user defined ranges to reduce the Optimized Effort based on the assumption that larger tolerance ranges = less effort.
•Update Model Tolerances: Pushes the altered tolerances back into the current 3DCS model. Please note this function cannot be undone.
•Summary: Exports the data to Notepad.
•Options: Opens a dialog box that allows you to specify Measurement Precision, Range Precision, Factor Precision, Tolerance Range Plus/Minus, Tolerance Cost Factor, and Measure SigmaNum (+/-) values.
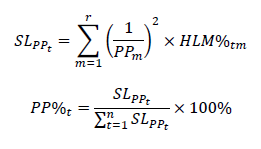
•PP%: The ratio of the upper and lower specification limits (USL and LSL) to the measurement variation is called Process Performance (Pp). This value presumes the specification limits are known and meaningful and are centered about the measurement variation. As the measurement variation increases, the out-of-spec results also increase and the Pp decreases.


| Where USL is the upper spec limit, LSL is the the lower spec limit, sigma is the standard deviation from the 3DCS Analysis Report window or from GeoFactor Analyzer, SL is the significance level, t is a tolerance in the model, n is the total number of tolerances in the model, m is a measurement in the model, r is the total number of measurements in the model, and HLM% is the percent contribution of a tolerance for a particular measurement. |
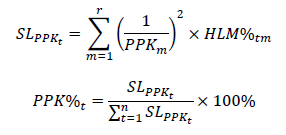
•PPK%: The Process Performance Index (Ppk) is similar to Pp (see PP% below.) It is a ratio of the upper and lower specification limits (USL and LSL) to the measurement variation and also considers the mean values. Mean values are important because if the measurement variation is not centered (mean shift) within the spec limits then the out-of-spec results will increase. If a tolerance's Significance Level percentage increases in Ppk-based model analysis versus Pp-based model analysis, then it may be possible to change the design to reduce the out-of-spec results.


| Where USL is the upper spec limit, mu is the mean value, LSL is the the lower spec limit, sigma is the standard deviation from the 3DCS Analysis Report window or from GeoFactor Analyzer, SL is the significance level, t is a tolerance in the model, n is the total number of tolerances in the model, m is a measurement in the model, r is the total number of measurements in the model, and HLM% is the percent contribution of a tolerance for a particular measurement. |
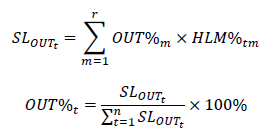
•OUT%: If the model tends to have significant out-of-spec results (Out%) for all of its measurements, then it may be better to directly use this value to calculate the Significance Level.


| Where N_out is the number of out-of-spec samples, N is the total number of the samples (or runs) in the Monte Carlo simulation, SL is the significance level, t is a tolerance in the model, n is the total number of tolerances in the model, m is a measurement in the model, r is the total number of measurements in the model, and HLM% is the percent contribution of a tolerance for a particular measurement. |
•Ave%: Simply, the Ave% is an average of all of the contributing percentages for each measurement.

| Where HLM% is the percent contribution of a tolerance for a particular measurement, t is a tolerance in the model, m is a measurement in the model, and r is the total number of measurements in the model. |
•Show contributor Parent: Displays an extra column between Contributor and Range that specifies the Parent part that each tolerance is applied in.
•%Filter: Contributors with percent contributions below the number specified in the text box to the right will be filtered out of the CTI Matrix to assist in identifying important contributors in a large matrix.
•Summary: Exports the data to Notepad.
•Update: Updates the results if a Weight value is changed.
❖ 1.4 DCS Tolerance Optimizer Equations
Current and Optimized Effort for each tolerance has a logarithmic relationship to the tolerance value.


Where t is a tolerance in the model and n is the total number of tolerances in the model. As a tolerance is tightened it costs more. Conversely, as a Current Range or Optimized Range value approaches the Max Possible Range allowed, the tolerance is loosened and becomes cheaper. Since these equations are based on the Max Possible Range values if these values are changed the Effort values will change. The Cost Factor represents the incremental cost and its starting point is being changed.
If the Current Range or Optimized Range value equals the Max Possible Range then the tolerance becomes "free."