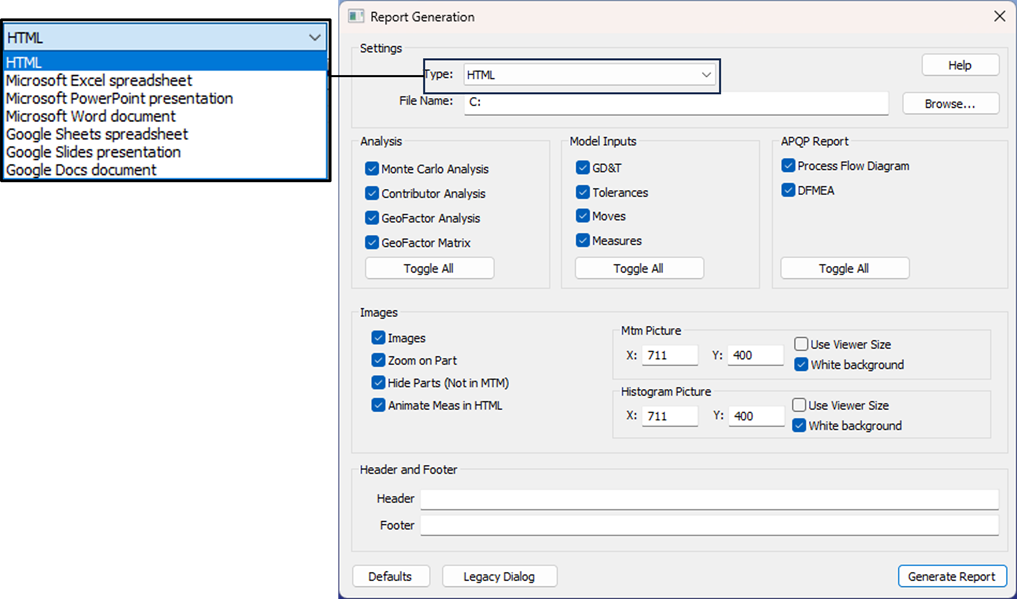
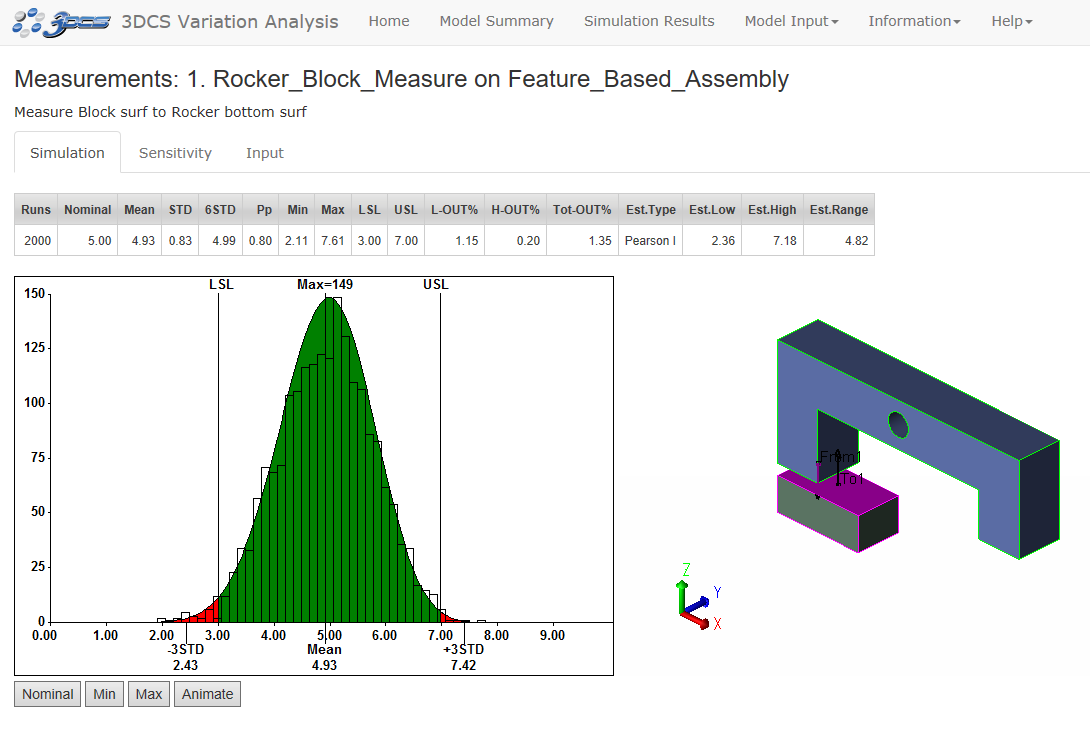
An HTML Report is nicely formatted to work in most browsers. The report is separated by tabs, detailing the Cover Page, Simulation Results, Model Input and more. The HTML Report also supports Animation with measures, showing the parts Min, Max and Nominal positions of those measures.
|


Procedure - Generating a Report from a Simulation: When Generating a Report, it is required to keep the Simulation window open; the GeoFactor/Contributor Analysis will need to be active to view the Contributors or the GeoFactor graph.
1.Click Run Analysis ![]() from the Analysis toolbar. Check on Monte Carlo, GeoFactor and Contributor Analysis.
from the Analysis toolbar. Check on Monte Carlo, GeoFactor and Contributor Analysis.
2.Select the Options Tab then check the box to Generate Report and click Start.
3.After the Simulation has completed, an HTML report will automatically open in a web browser.
4.To edit this report, go to ![]() Report Generation, or from the Options tab in the run Analys dialog, check on Generate Report and click the Report Options button.
Report Generation, or from the Options tab in the run Analys dialog, check on Generate Report and click the Report Options button.

Best Practice - Generating a new Report - No Simulation data:
1.Locate the ![]() Generate Report, located on the Statistical Analyst toolbar.
Generate Report, located on the Statistical Analyst toolbar.
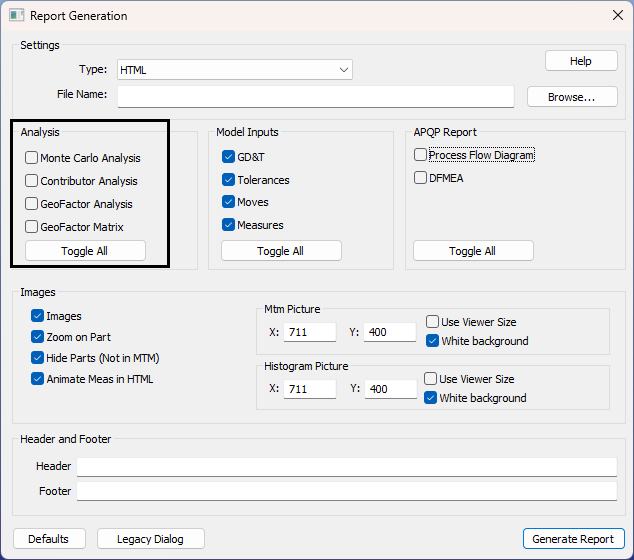
2.Select the options for MTM or GD&T images. The report will display if the Monte Carlo analysis, Contributor Analysis, GeoFactor Analyzer (AAO) and GeoFactor Equation-Based.
3.The user can then decide to create a report in HTML, Excel, PPT, Word, Google Docs, Google Slides, or Google Sheets.