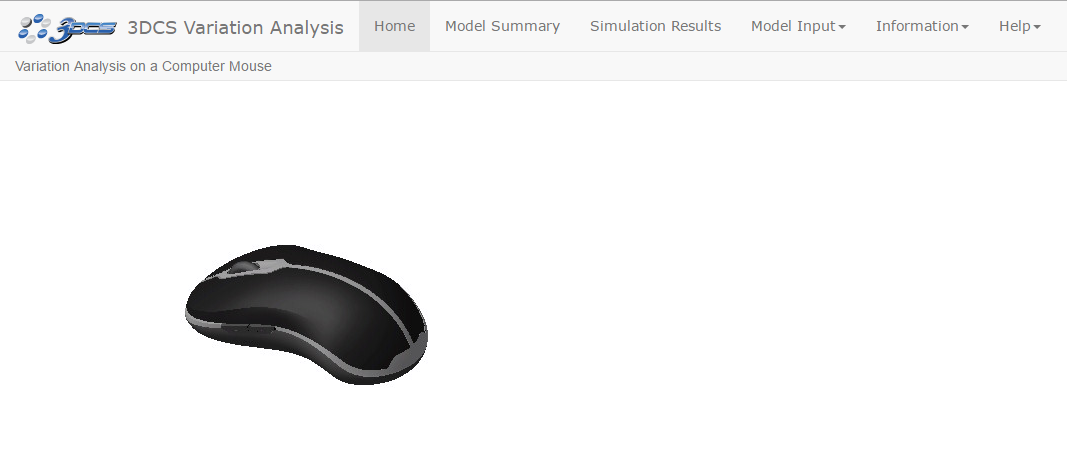
Report pages, the finished product. After going through each MTM and setting the views; adding Notes, Summaries; changing the names of features or using Alias Display, the report is ready.
The report can be saved in any location. It packages nicely with the Cover Page, Model Summary page, Notes and Images into a folder and the main HTML page.
|
Cover Page

The ![]() Model Summary is the summary of the model, containing information about the model, such as Tolerance changes, assumptions, specific part tolerance information, or to display any information the user needs to report.
Model Summary is the summary of the model, containing information about the model, such as Tolerance changes, assumptions, specific part tolerance information, or to display any information the user needs to report.
A ![]() Model Summary can be created by going under the
Model Summary can be created by going under the ![]() Generate Report icon, or by right-clicking on the top assembly and selecting
Generate Report icon, or by right-clicking on the top assembly and selecting ![]() Model Summary. The first time a user creates a Model Summary, Microsoft Word will open with a template of a Model Summary. The can change the template information and then close the report. 3DCS will prompt the user to either save the Model Summary or cancel the changes made to the template.
Model Summary. The first time a user creates a Model Summary, Microsoft Word will open with a template of a Model Summary. The can change the template information and then close the report. 3DCS will prompt the user to either save the Model Summary or cancel the changes made to the template.

Notes:•The Model Summary is saved or stored as an HTML temporary file. When the user opens Model Summary in 3DCS, 3DCS will convert the text back to a Word file (.docx). This means that anything created in Word, such as a table or an image defined in Word, may not appear correctly in the Report.
|
Analysis Results filters: The Analysis Results is a table of all the measures defined in the model. This table reports all of the Statistical data that is active in the Monte Carlo/Contributor Analysis options. In order to add or remove any statistical results, users will need to add or remove them from the Analysis Summary window, under View -> Options and under the Monte Carlo or Contributor Analysis tabs.
•The Analysis Results page will show when the user has Run a Simulation with Monte Carlo. Then, in the Report Generation dialog, the user will need to activate Monte Carlo to include them in the report. The Windows will need to remain opened for the results to be shown in the report.
•Users can sort any column, in descending or ascending order. The user can also filter out numbers in each column by just typing a number under the name of the column and the page will update based on the number entered.

Conditional Formatting: Users can display different filters to show different color format based the statistical output and two input numbers. The Conditional Formatting can be used with any Statistical results in Monte Carlo Analysis.
•Adding a value in the Target value field will make the rows with smaller value yellow. Anything higher than the Target value will be shown as green.
•Adding a value in the Marginal value field will make the rows with a smaller value red. Anything higher than the Marginal value will be shown as yellow.
•In this example, the Estimated Range is showing, with a Target value = 5, and Marginal value = 0.5. Notice the 5.30mm in the Est. Range column is show as green. While the 4.62mm, 4.34mm, and the 0.84mm are all yellow.
