|
|
|
Review these DE Focus Articles, available at Community.3dcs.com Model Sensitivty Analysis (Issue 94 - February - 2011) (Model Available) Model Sensitivity Calculation (Issue 95 - March - 2011)
|
Commands
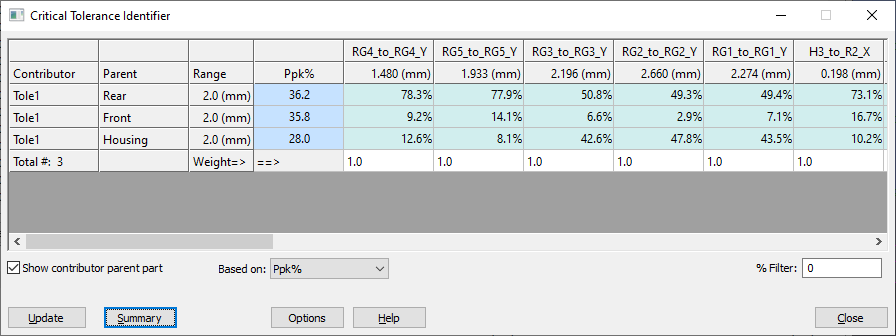
•To go to a measurement or contributor, double-click on the left to edit a tolerance, or the top to edit a Measure.
•Show contributor Parent: Displays an extra column between Contributor and Range that specifies the Parent part that each tolerance is applied to.
•Based On: Displays only one column of results at a time based on this drop-down list. The default is Ppk%. Choose from the following: Ppk%, Pp%, Out%, or Ave%.
•HLM % / Geof % dropdown list: Chooses whether the percent contributions from the HLM Analyis results or the GeoFactor Analysis results are used in the CTI Analysis.
•%Filter: Contributors with an overall percent contribution below this value will be hidden.Summary: Exports the current summary from DCS KC sensitivity function matrix (including Key Characteristics Sensitivity and HLM Percentage) to Notepad.
•Update: Adjusts Ppk%, Pp%, Out%, and Ave% based on any changes in the Matrix window.
The Critical Tolerance Identifier Matrix is used to determine the ranking of tolerance contributors in a model. This Matrix can help identify which tolerances should be edited for better overall cost and quality. Depending on the most applicable analysis method to your model, the highest Pp%, Ppk%, Out%, or Ave% contributor impacts the model most and will be most expensive to change.
•PP%: The ratio of the upper and lower specification limits (USL and LSL) to the measurement variation is called Process Perfomance (Pp). This value presumes the specification limits are known and meaningful and are centered about the measurement variation. As the measurement variation increases, the out-of-spec results also increase and the Pp decreases.
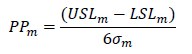
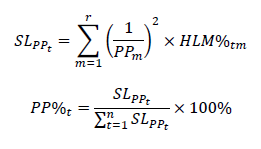
where m is a measurement in the model, USL is the upper spec limit, LSL is the the lower spec limit, sigma is STD from 6.00STD in the 3DCS Analysis Report window, SL is the significance level, t is a tolerance in the model, r is the total number of measurements in the model, HLM% is the percent contribution of a tolerance for a particular measurement, and n is the total number of tolerances in the model.
•PPK%: The Process Performance Index (Ppk) is similar to Pp (see PP% below) in that it is a ratio of the upper and lower specification limits (USL and LSL) to the measurement variation, but also considers mean shift. If the measurement variation is not centered (mean shift) within the spec limits then the out-of-spec results will increase. If a tolerance's Significance Level percentage increases in Ppk-based model analysis versus Pp-based model analysis, then it may be possible to change the design to reduce the out-of-spec results.
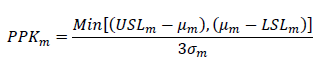
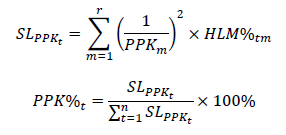
| where m is a measurement in the model, USL is the upper spec limit, mu is the mean shift, LSL is the the lower spec limit, sigma is a standard deviation from 6.00STD in the 3DCS Analysis Report window, SL is the significance level, t is a tolerance in the model, r is the total number of measurements in the model, HLM% is the percent contribution of a tolerance for a particular measurement, and n is the total number of tolerances in the model. |
•OUT%: If the model tends to have significant out-of-spec results (Out%) for all of its measurements, then it may be better to directly use this value to calculate the Significance Level.
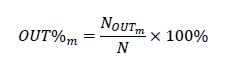
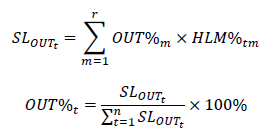
| where m is a measurement in the model, N_out is the number of out-of-spec samples, N is the total number of the samples (or runs) in the Monte Carlo simulation, SL is the significance level, t is a tolerance in the model, r is the total number of measurements in the model, HLM% is the percent contribution of a tolerance for a particular measurement, and n is the total number of tolerances in the model. |
•Ave%: Simply, the Ave% is an average of all of the contributing percentages for each measurement.
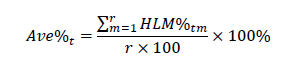
| where t is a tolerance in the model, m is a measurement in the model, r is the total number of measurements in the model, and HLM% is the percent contribution of a tolerance for a particular measurement. |
•Weight: Allows the user to change the influence of the measure.