SBS will use an existing model to demonstrate its usability. A set of activities will be performed to illustrate various scenarios.
•Launch 3DCS Variation Analyst.
•Open the SBS_Tutorial.wtx model from
C:\Users\Public\Public Documents\DCS\3DCS_V5_8_2_0_0\Tutorials\V5SWMCNXV6CREO_AAO_Tutorial\SBS_Tutorial
•This model includes:
- One part with two points defined as circle centers
- Feature, Circular and Linear tolerances
- Point Distance, Circle Diameter and Combination measurements
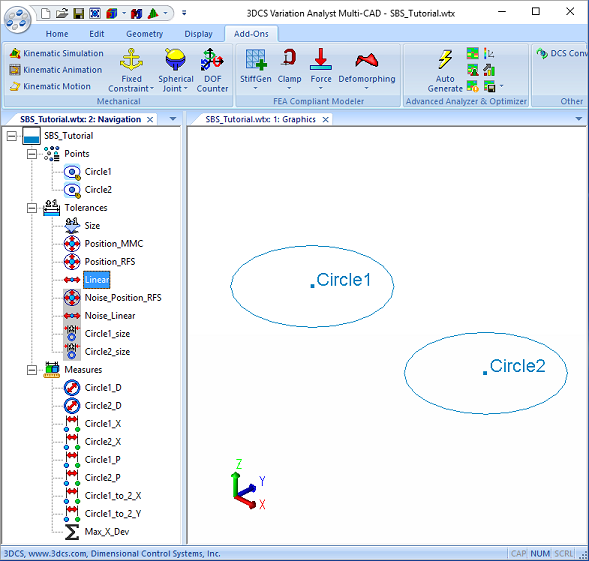
•Nominal Build the model.
•In the Advance Analyzer and Optimizer toolbar and click on the ![]() Simulation-Based Sensitivity icon. This will open the Simulation-Based Sensitivity dialog:
Simulation-Based Sensitivity icon. This will open the Simulation-Based Sensitivity dialog:
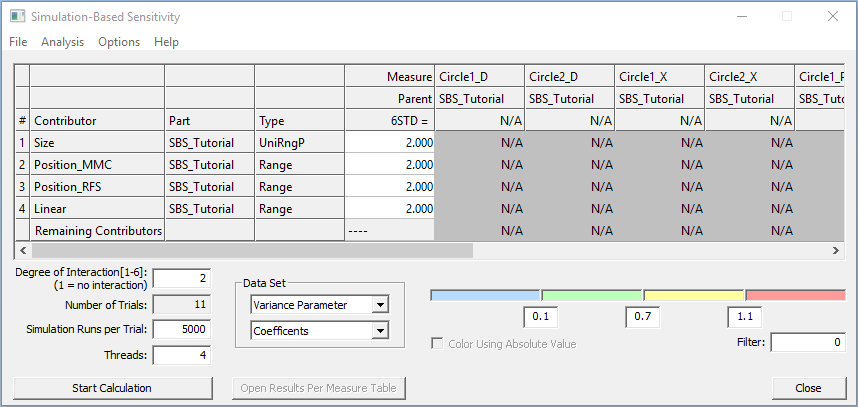
•The above table includes all active part tolerances and measures. Tolerances types and ranges are shown. For example, a type of Range indicates a bilateral range.
•Set the following inputs:
a.Degree of Interact = 4 (this will result in 16 trials)
b.Simu Run Num = 5000 (will run 5000 samples using the Monte Carlo Simulation)
c.Threads = 4 (the number of Threads indicates the number of logical processors available on user's computer that can be used during the calculation)
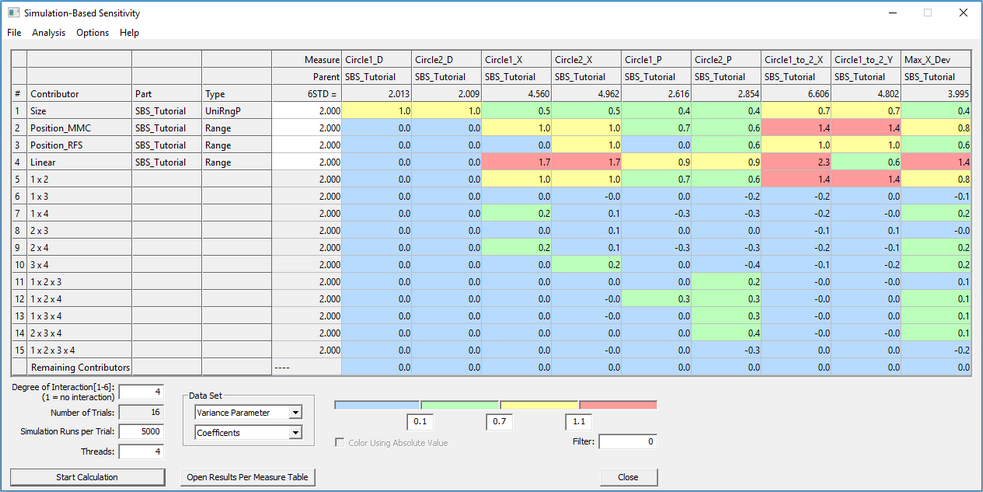
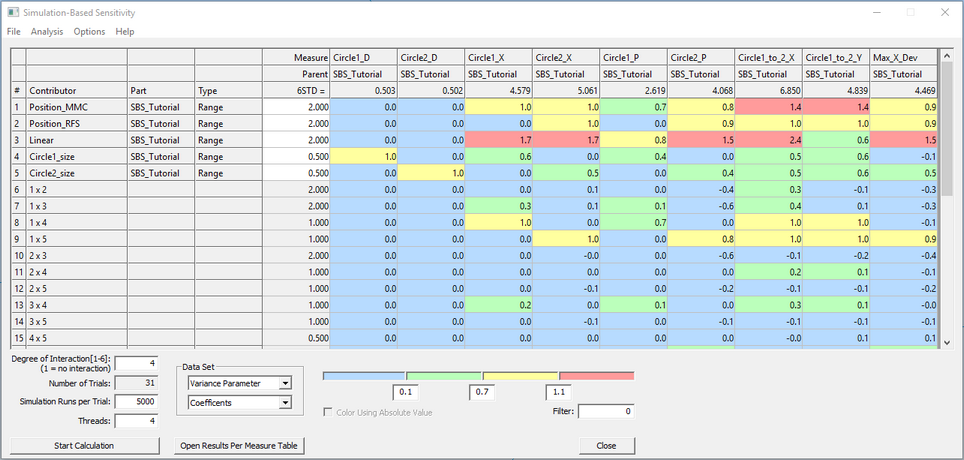
•Click the [Start Calculation] button. A Running Simulation-Based Sensitivity... dialog will appear showing the calculation progress. When finished the Simulation-Based Sensitivity matrix is updated as shown below:
•Under File select [Save SBS File] option and save the results SBS_Tutorial_doer_4_cont.sbs.
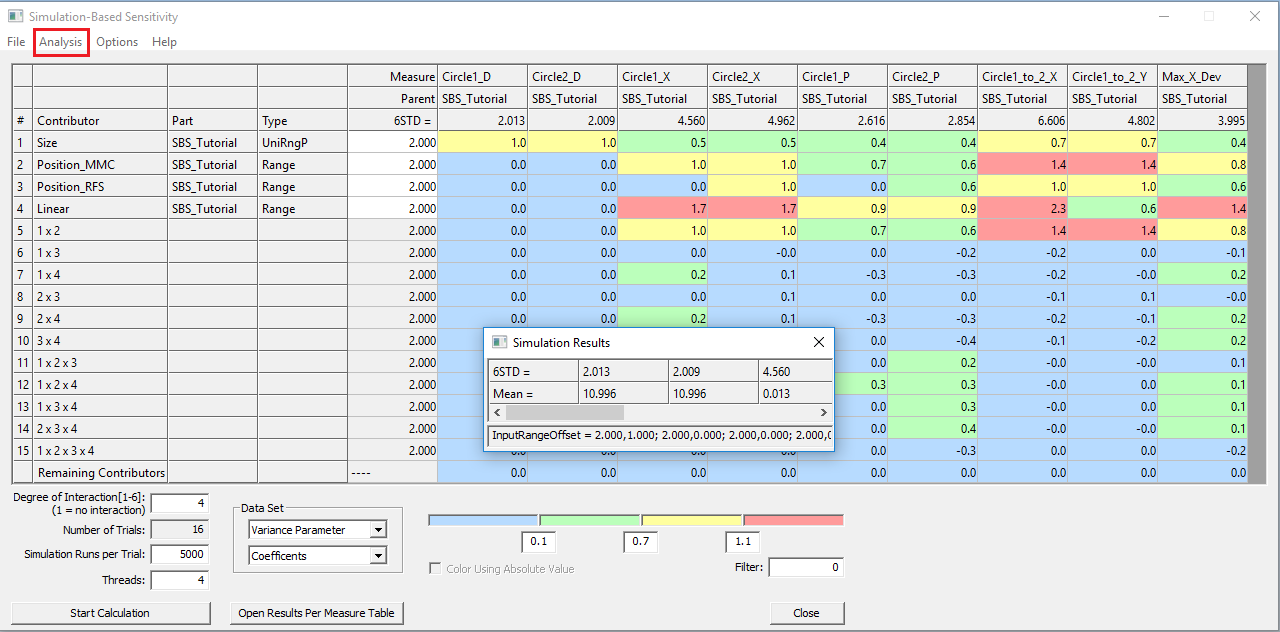
•Compare the SBS results to the simulation results. Click Analysis tab in the SBS window, select Run Simulation from the drop-down menu. A table will appear with the simulation results for the measures.
Conclusions:
•The 6STD results from SBS and the simulation match perfectly because all the of contributor-measure relationships have been analyzed by SBS.
•Diameter measures are not affected by any contributors except the Size tolerance. See measures Circle1_D and Circle2_D.
•The Size tolerance affects the position measures because they are also affected by the position at MMC tolerance.
•Row 5 shows the effect of the interaction of Row 1 and Row2. This interaction occurs because the position at MMC tolerance adds bonus variation.
•Change the Data Set to Mean Parameter and Amounts from the drop-down. Notice the Size tolerance causes a mean shift in the Diameter measures. This is because the tolerance is applied as a unilateral tolerance. Change the range of the Size tolerance to 1.5. Notice the predicted mean of the diameter measures is reduced to 10.75 mm.
•Change the Data Set to Variance Parameter. Notice the predicted 6STD results no longer match the simulation results. Run a new set of simulation with the modified Size tolerance range. Click Analysis, then Run Simulation. A second table will appear with the simulation results for the measures. Notice these results match perfectly for some measures but are slightly different for others. The measures that are slightly off are not perfectly linear even when all the interactions have been calculated.
Next, run SBS with different tolerances active in the model.
•Close all the Simulation Results and SBS windows.
•Deactivate the Size tolerance and activate all the other tolerances.
•[Nominal Build] the model.
•Go to Advance Analyzer and Optimizer toolbar and click on the Simulation-Based Sensitivity icon.
•Under Analysis select Refresh from Model to update the changes in the model in SBS. Seven direct contributors should be shown.
•Select one of contributors named Noise... and right-click and select Remove Rows
•Repeat with the other contributor named Noise... Now only five direct contributors should be shown. The Noise... contributors will still vary and their effect will be combined in the Remaining Contributors row.
•Click the [Start Calculation] button to run the results.The dialog will appear as shown below:
• Select File -> Save SBS File option and save the SBS_Tutorial_doer_6_cont.sbs.
•Compare the SBS results to the simulation results. Click Analysis, then Run Simulation. A table will appear with the simulation results for the measures.
Conclusions:
•Now instead of one size tolerance affecting both circles, each circle has a separate contributor. This makes it easier to see which circle affects which measure.
•The Noise... tolerances have a large effect on the measure results as shown by the values in the Remaining Contributors row for both the Variance Parameter and Mean Parameter view.