Simulation-Based Sensitivity (SBS) is an analysis tool that helps the user understand the effects of contributors on the variation and mean shift of each measure. SBS has been added to the AAO Toolbar under Add-Ons.
Along with SBS, 3DCS users have these analysis tools available to interpret the model results and make informed decisions on how to improve them. All these analyses calculate the percent contributions of the tolerances, GD&T, and move "floats" to the measure variation.
• HLM (Sensitivity Analysis): uses "High Low Median" methodology to determine the effect of individual tolerances on a given measure. The Sensitivity results do not report the geometric effects on the measures but the HLM calculations do take these effects into account.
• GeoFactor: analyzes the tolerance contribution from the geometry effect by calculating a G Factor for each contributor-measure pair. The G Factor is independent of a tolerance's range, distribution, and scale (but these are considered in the percent contribution.) In essence, the G Factor number is the slope of a line relating the measure value to the tolerance deviation.
• AAO: GeoFactor Analyzer organizes the GeoFactor results into a matrix and allows grouping of contributors.
• AAO: Critical Tolerance Identifier combines results from multiple analyses and multiple measures to indicate which contributors are most important to the entire model.
Except for SBS, all of these tools analyze the model by moving a single contributor to a small number of deviated positions and recording the change in the measure result. SBS analyzes the model by running multiple simulations with the contributors set to different ranges. This allows much more information to be derived from the model at the cost of a much longer analysis run time.
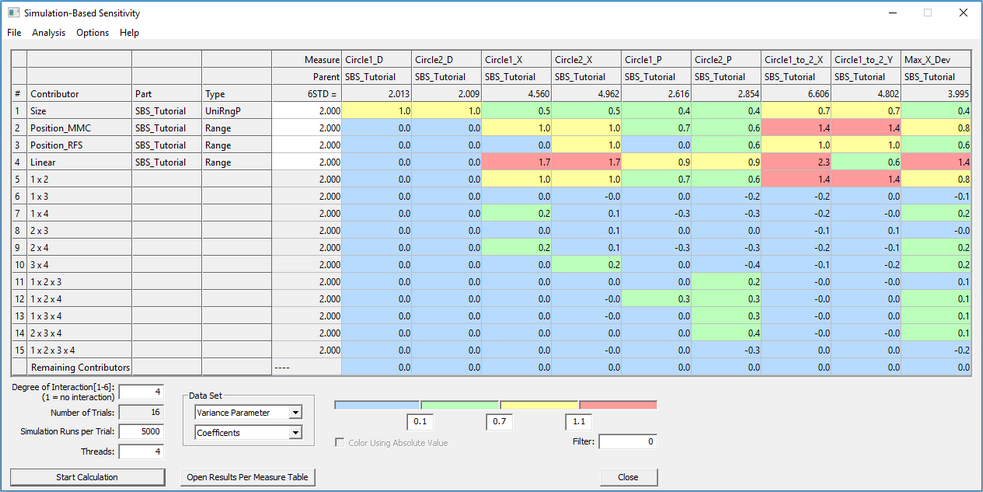
The left-hand columns display the contributors' names, parent part, type, and range values.
The top rows display the predicted six-sigma or mean results for each measure depending on the view selected.
•Variance Parameter: expected six-sigma ranges
•Mean Parameter: expected mean results
Three types of values can be displayed in the SBS matrix.
•Amounts are how much a contributor increases or reduces a measure result.
•Percent Contributions are the relative effect a contributor has on a measure result.
•Coefficients are the slope of the line relating the tolerance range and the measure results if the relationship is assumed to be linear.
Two types of contributors are listed in the SBS matrix.
•Direct contributors are the tolerances, GD&T, and move floats in the model. The user can edit their ranges in SBS after running the analysis.
•Interactions are the combined effect of two or more Direct Contributors, separate from the effects of the Direct Contributors themselves. An Interaction can cause the measure six-sigma range to increase (an amplifying effect) or decrease (a mitigating effect.) When the range of a direct contributor is changed, the effects of interactions including it are also updated.
Any measure or direct contributor can be double-clicked to open it.
See also: http://blog.3dcs.com/simulation-based-sensitivity-solves-non-linear-and-complex-interactions-in-your-tolerance-analysis-models