The Show Graph function selects and shows the selected assembly positions for a model. The assembly model can be a hole/pin assembly, a gap, a flush, etc. Pending on the selection that the user makes, the assembly can be in one extreme position (minimum or maximum) , at +/- 1 STD, +/- 2 STD, +/- 3 STD, +/- 4 STD, +/- 5 STD or at mean.
Procedure:
•Run Analysis. See Simulation Procedure.
•Activate the Simulation window.
•Click on View ![]()
![]() Show Graph. The Simulation Graph Control dialog box appears.
Show Graph. The Simulation Graph Control dialog box appears.
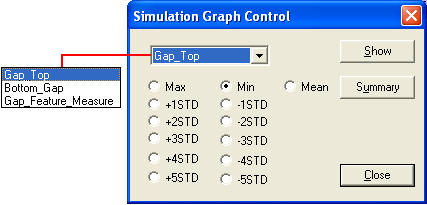
•In the drop-down box, select the type of measurement you wish to view.
•Select Max, Min, +1 STD, etc.
Note:This function determines the closest measurement, for all simulations, to the selected option, and displays that specific simulation graphically. The measurements for all other assembly positions are set as well.
|