Sigma*G Factor*6 = Effective 6-Sigma
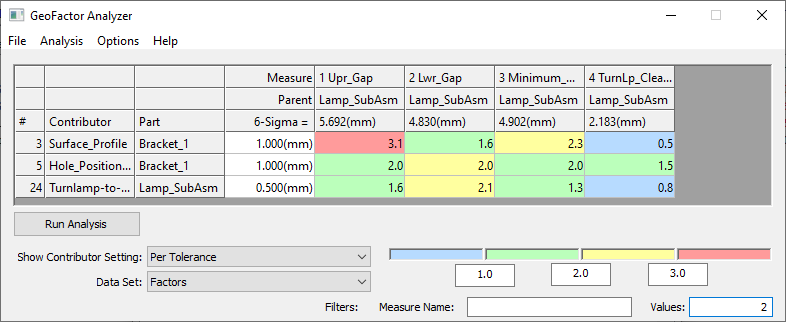
With the GeoFactor Analyzer, the tolerance changes can be made in the graphical interactive matrix providing instantaneous feedback of updated results, the Contributor results can viewed in a numerical or a graphical format, and where a color-coded matrix of the Contributor Index can interactively emphasize contributors that are of greater importance to the measurements.
•Make changes to Tolerances and see instant results. •Measurement values are equal to the GeoFactor's calculated 6-Sigma values. •View result by Feature or Tolerance; Percentage or Factor. |

Procedure - Run Analysis
1.Open a model with Tolerances, Moves and Measures, and run a Simulation. The Contributor Analysis required to view the results in GeoFactor Analyzer.
2.Launch the ![]() GeoFactor Analyzer dialog. Notice the dialog has been populated with the Contributor results from the Simulation done in the first step.
GeoFactor Analyzer dialog. Notice the dialog has been populated with the Contributor results from the Simulation done in the first step.
3.Make sure Per Tolerance is specified. (Other functions are blocked from changing the tolerance value).
4.Select in any of the Tolerance ranges, under the 6-Sigma column.
5.Apply a new tolerance value and Enter. The results will update based on the new Tolerance range applied in the 6-Sigma column.
Procedure - Open HLM file
1.Launch ![]() GeoFactor Analyzer.
GeoFactor Analyzer.
2.In the window, go to File -> Open and locate an HLM file. (Default location of previous ran Contributor Analysis is: C:\Users\<username>\Documents\DCS\DCS_SA\analysis)
3.Make sure Per Tolerance is specified. (Other functions are blocked from changing the tolerance value).
6.Select in any of the Tolerance ranges, under the 6-Sigma column.
7.Apply a new tolerance value and Enter. The results will update based on the new Tolerance range applied in the 6-Sigma column.
Commands:
•Filter: When the rows have all numbers smaller that the Filter value, they will be hidden.
•Legend: Allows setting values that will color the coefficients based on these values for a better visual identification of critical coefficients/tolerances.
•Show Measure: Shows the contributing points/features involved in the selected measurement.
•Show Tolerance: Shows the contributing points/features involved in the selected tolerance.
Drop-down Lists - Show Contributor Settings
•Per Feature: Displays the individual GeoFactor coefficient for each point/feature in the given tolerance. The benefit of this mode is to highlight the individual point/feature with a high coefficient within the given tolerance. This setting will produce exactly the same results as Geo Factor.
•Per Tolerance: Combines all the individual point/feature GeoFactor coefficients of the given tolerance by a RSS. The benefit of this mode is to observe the combined coefficient of that tolerance while minimizing the rows in the Analyzer Matrix. Example: Contributor Per Tolerance - sqrt(feat1(tol1)^2+feat2(tol1)^2+...)
•Per Tolerance Features: Combines all tolerances with same features.
•Per Part: Combines all tolerances in each part.
•Per Tolerance Name + Type: Combines all tolerances with same type and name.
•Process Capability DB Link: Combines all tolerances with the same Process Capability DB linking item.
Data Set
•Factors: Displays the numeric value of the GeoFactor.
•Percentages: Displays the GeoFactor value as a percentage.
File menu
•Open - Open an HLM file into GeoFactor Analyzer.
•Save - Save an HLM file, which can be opened in GeoFactor Analyzer or Contributor Analysis.
•Refresh - Updates the matrix display with any tolerance changes.
•Summary - Displays the values and lists in a CSV or Notepad format.
•Exit - Closes the dialog.
Analysis menu
•Apply ranges to tolerances - will update the model tolerances range and offset value to match the values displayed in the GeoFactor Analyzer dialog.
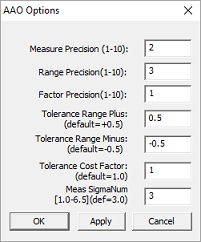
Options menu - Allows setting the default values for measure, tolerance and factor (coefficient) decimals.
|
•Measure Precision: Changes the decimal place value for Measures, across the top of the GeoFactor Analyzer, SBS and CTI dialogs. •Range Precision: Changes the decimal place value for the Tolerance Range value for GeoFactor Analyzer, Simulation Based Sensitvity (SBS), Critical Tolerance Identifier (CTI), Tolerance Optimizer, LSA dialogs. •Factor Precision: Changes the decimal place value of the Factors or overall display of the GeoFactor Analyzer dialog. •Tolerance Range (Plus/Minus): Applies to the Critical Tolerance Identifier (CTI) dialog, changing the affective tolerance range for the Target 6-Sigma. •Tolerance Cost Factor: Changes the Cost Factor value in the Critical Tolerance Identifier dialog. •Measure Sigma Num: Changes the Sigma value for Measures in GeoFactor Analyzer, Simulation Based Sensitivity, |
RH Menus
Use the right-hand mouse button anywhere in the GeoFactor Analyzer to bring up the following commands:
•Column Ascending, Column Descending: Sorts the coefficients in the selected column in ascending or descending order. The other coefficients are also sorted to match the selected column's selection.
•Row Ascending, Row Descending: Sorts the coefficients in the selected row in ascending or descending order. The other coefficients are also sorted to match the selected row's selection.
•Hide Column: Will hide the selected column
•Un-hide Column: Right click on the shrunk column to un-hide it.
•Un-hide All Columns: Right click on one of the shrunk columns to un-hide all.
![]() To go to a Measurement or Contributor, double-click it and it will open the measurement or tolerance dialog.
To go to a Measurement or Contributor, double-click it and it will open the measurement or tolerance dialog.
