AAO leverages and expands the existing equation based GeoFactor product. The tool utilizes coefficients derived from GeoFactor or DOE (Design of Experiments) to support non-linear models. This new module is comprised of several core functionalities including:
Analyzer: An equation based analysis output that precisely identifies the amount and source of variation within an assembly. 3DCS Analyzer creates an equation of the entire 3DCS model and displays the inputs (contributors/tolerances) and outputs (measurement results) and their relationships (Coefficients of Influence) in a graphical interactive matrix. The 3DCS model is converted into an equation based model where:
Optimizer: A tool for optimizing tolerances to achieve the desired quality based on a minimal effort. User inputs possible tolerance ranges, cost factor, as well as the target variation in the system, and the Optimizer will automatically solve for optimized tolerances and validate feasibility.
|
|||||||
Topics:
|
See also: |
||||||
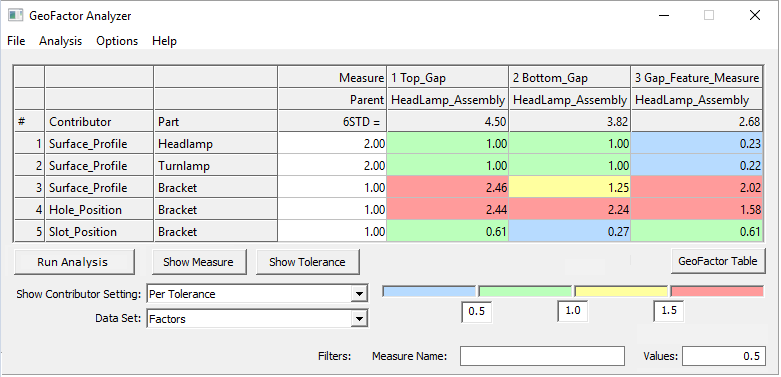
![]() Geo Factor Analyzer: Provides the user with an enhanced version of GeoFactor results.
Geo Factor Analyzer: Provides the user with an enhanced version of GeoFactor results.
![]() Simulation-Based Sensitivity (SBS) is an analysis tool that helps the user better understand the behavior of a 3DCS model providing information about variance, mean shift, and geometric coefficients.
Simulation-Based Sensitivity (SBS) is an analysis tool that helps the user better understand the behavior of a 3DCS model providing information about variance, mean shift, and geometric coefficients.
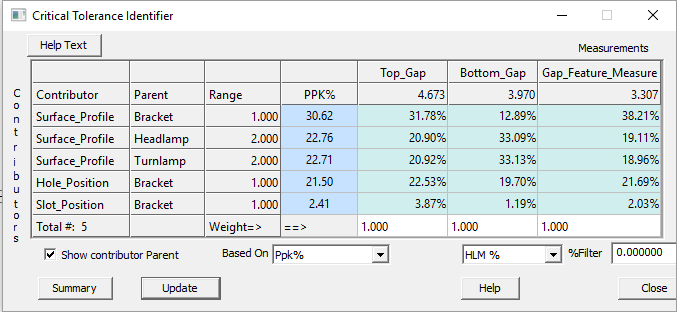
![]() Critical Tolerance Identifier (CTI): This is a meta-analysis tool that identifies the critical tolerances in a model.
Critical Tolerance Identifier (CTI): This is a meta-analysis tool that identifies the critical tolerances in a model.
![]() Locator Sensitivity Analyzer (LSA): predicts how well a move controls a part or sub-assembly.
Locator Sensitivity Analyzer (LSA): predicts how well a move controls a part or sub-assembly.
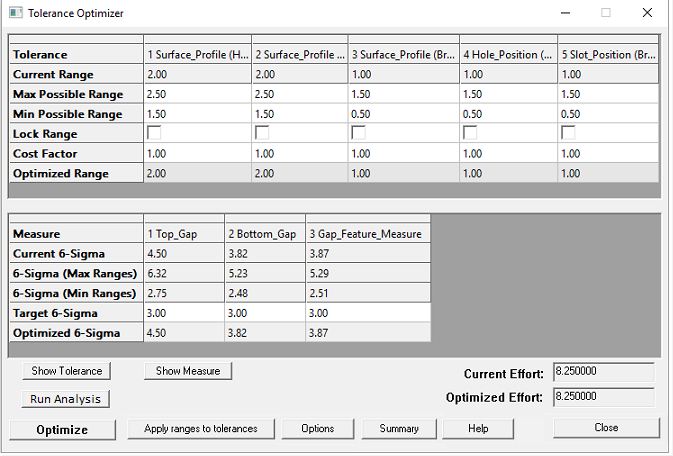
![]() Tolerance Optimizer: This is used to achieve the desired quality at a minimum cost.
Tolerance Optimizer: This is used to achieve the desired quality at a minimum cost.
![]() Sequence Optimizer (SO) is a tool designed to reduce lead and launch time by eliminating or minimizing manual join/clamp sequence studies.
Sequence Optimizer (SO) is a tool designed to reduce lead and launch time by eliminating or minimizing manual join/clamp sequence studies.
![]() Datum Optimizer (DO) is a tool designed to determine the optimal datums from a candidate set with the goal of minimizing the rigid part variation or compliant part deformation.
Datum Optimizer (DO) is a tool designed to determine the optimal datums from a candidate set with the goal of minimizing the rigid part variation or compliant part deformation.
![]() AAO Export: The export function saves the geometric matrix as a *.sov file in a user defined location.
AAO Export: The export function saves the geometric matrix as a *.sov file in a user defined location.
![]() AAO Import: To successfully import a *.sov file the concurrent model must also be open.
AAO Import: To successfully import a *.sov file the concurrent model must also be open.
GeoFactor Analyzer
Critical Tolerance Identifier
Tolerance Optimizer
Procedure
1.Launch 3DCS Variation Analyst software and assure the Advanced Analyzer and Optimizer license is set in the 3DCS Preferences.
2.Open or create a 3DCS variation analysis model.
3.Generate the matrix using the ![]() GeoFactor Analyzer, or go to Tools
GeoFactor Analyzer, or go to Tools ![]() Advanced Analyzer Optimizer. This will create a *.gf2 file in the default directory, or in a directory selected by the user.
Advanced Analyzer Optimizer. This will create a *.gf2 file in the default directory, or in a directory selected by the user.
4.The user can export the *.sov file using AAO Export icon ![]() , or import into the currently loaded model a previously saved matrix, using AAO Import icon
, or import into the currently loaded model a previously saved matrix, using AAO Import icon ![]() from the toolbar. The edited tolerances and updated 6 sigma values within the GeoFactor Analyzer will be exported on AAO Export.
from the toolbar. The edited tolerances and updated 6 sigma values within the GeoFactor Analyzer will be exported on AAO Export.
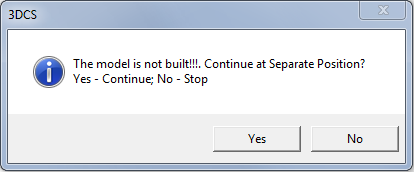
If the model is not Built prior to Running AAO, a warning message will appear:
|
5.Run the ![]() GeoFactor Analyzer function from the toolbar and interact with the matrix. User can enter "what if" tolerance values and immediately see updated measurement results.
GeoFactor Analyzer function from the toolbar and interact with the matrix. User can enter "what if" tolerance values and immediately see updated measurement results.
6.Run the ![]() Critical Tolerance Identifier (CTI) function from the toolbar. User can visualize tolerance through a color-coded matrix of the Contributor Analysis Index, and interactively emphasize contributors that are of great importance to the measurements.
Critical Tolerance Identifier (CTI) function from the toolbar. User can visualize tolerance through a color-coded matrix of the Contributor Analysis Index, and interactively emphasize contributors that are of great importance to the measurements.
7.Run the ![]() Tolerance Optimizer function from the toolbar. Enter the individual measurement goal values, cost per tolerance and Min\Max Tol values and press the minimum cost button. Optimized tolerances will be calculated and user can perform additional experiments.
Tolerance Optimizer function from the toolbar. Enter the individual measurement goal values, cost per tolerance and Min\Max Tol values and press the minimum cost button. Optimized tolerances will be calculated and user can perform additional experiments.