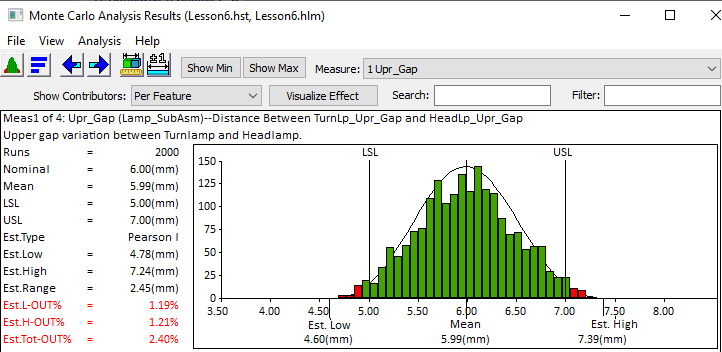
3DCS Convergence is designed to help the user determine how many samples to run to ensure the results are within a predefined interval.
After running simulations, 3DCS calculates statistics for the output variables.
The value for mean, standard deviation (σ), estimated range, etc. are point estimates of the true population parameters.

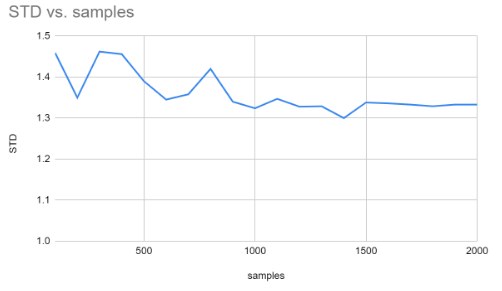
The point estimates will change as you run more (or fewer) samples. As you run more simulations, the point estimates will change less and less--they will converge to the true population parameter values.

How many samples are needed to ensure the statistics converge to the population parameters?
3DCS Convergence uses the statistic standard deviation (STD) as the convergence criteria. STD is the single best estimate of variation and drives estimated high and low values.
Note: The mean value will converge before standard deviation.
Two parameters are required:
•Percent error of standard deviation
•Confidence Level
1.Percent error of standard deviation is the interval within which the true value of standard deviation will lie. The user can choose 1, 3, 5, or 10 percent of the standard deviation (STD).
If the user chooses 5% for Percent error of standard deviation
-> and the point estimate of STD is 1.0, then the true standard deviation will be within 0.05 units--roughly between 0.975 and 1.025.
-> if the point estimate of STD is 2.0, the true standard deviation would be within 0.1 units--roughly between 1.95 and 2.05.
❖ Percent error of standard deviation scales with the value of the standard deviation.
If the user chooses 3% for Percent error of standard deviation, and the point estimate of STD is 1.0, the true standard deviation would be within 0.03 units of 1.0.
❖ Percent error of standard deviation scales with the error size.
Notes:
➢As the user decreases the percent error for convergence, a larger sample size is required.
➢Critical output should have smaller percent error intervals.
2.Confidence level is a measure of risk. To be 100% confident, an infinite number of runs would be required!
Running a smaller number of simulations means there is a risk the percent error interval might be too small. Confidence Level is the percent of time the true standard deviation will be within the specified percent error. The user can choose 80%, 85%, 90%, 95%, and 99% for confidence levels.
-> If the user chooses, 99% confidence interval, there is a 1 in 100 chance the true standard deviation is outside the percent error interval.
-> If the user chooses 80% confidence, then there is a 1 in 5 (equivalent to 20%) chance the true standard deviation is outside the percent error interval.
Notes:
➢As the user increases the confidence level, more simulations are required.
➢Critical output should have higher confidence levels.
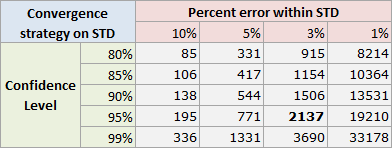
For each combination of percent error and confidence level, 3DCS has calculated the required number of simulations as shown in the table below.
The default number of simulations is 3% error and 95% confident. This requires 2137 simulations.

If a user needs more confidence and a smaller interval then more simulations are required. For example, to be 99% confident and within a 1% percent error 33,178 simulations are required.