![]() GeoFactor Analyzer (GFA) provides the user with an enhanced version of GeoFactor results.
GeoFactor Analyzer (GFA) provides the user with an enhanced version of GeoFactor results.
GeoFactor Analyzer is an equation-based analysis output that identifies the amount and source of variation within an assembly. GeoFactor Analyzer creates an equation of the entire 3DCS model and displays the inputs (contributors/tolerances) and outputs (measurement results) and their relationships (GeoFactor /Coefficients of Influence) in a graphical interactive matrix. The 3DCS model is converted into an equation-based model where tolerance changes can be made in the graphical interactive matrix providing instantaneous feedback of updated results, where analysis results are viewed in numerical or graphical format, and where a color-coded matrix of the Sensitivity Index can interactively emphasize contributors that are of greater importance to the measurements.
In summary, GeoFactor Analyzer shows the relationship between each tolerance and measure pair. The simplified Analysis is done using a numerical matrix format that places all tolerances and measurements in a single window.
•Open the AAO_Lever_Assembly model.
•Click ![]() [Nominal Build].
[Nominal Build].
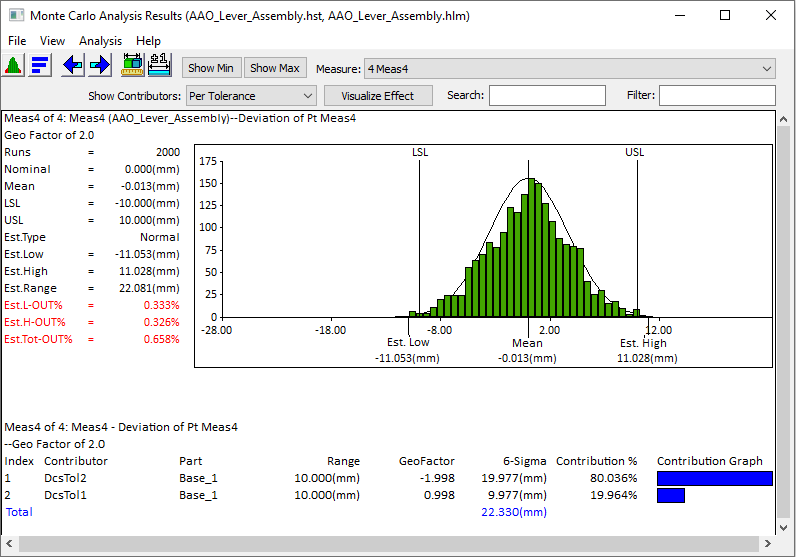
•Click ![]() [Run Analysis] for 2000 runs (inactive floats OK) and scroll through the measurements. Note that some results are out-of-spec (red in Meas4 below). This tutorial attempts to minimize those out-of-spec samples.
[Run Analysis] for 2000 runs (inactive floats OK) and scroll through the measurements. Note that some results are out-of-spec (red in Meas4 below). This tutorial attempts to minimize those out-of-spec samples.
•In the Analysis & Reporting toolbar click on the ![]() [GeoFactor Analyzer] icon.
[GeoFactor Analyzer] icon.
oClick [Run Analysis] from the dialog. The purpose of this button is to collect information from the existing 3D model to be used in calculating the matrix.
oClick [OK] to confirm the default File Path and the Gradient Step value. The matrix will be generated.
Note: If the GeoFactor Analyzer Matrix drops to the background, use Alt+Tab to bring it forward or click on the ![]() [GeoFactor Analyzer] icon.
[GeoFactor Analyzer] icon.
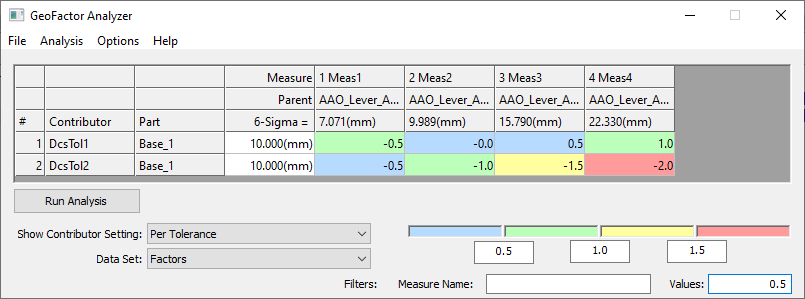
oFrom this chart you can see the Geo Factors for all measures at once with their respective measured values along with the tolerance ranges and names.
oYou can display factor value or percent contribution values in the matrix by selecting Factors or Percentage from the Data Set drop-down option.
oNote that the GeoFactors of Meas4 are 1 and -2 just as shown
oThe "white" fields are editable and can be modified by double-clicking the current value and typing in a new value.
>>>Your results may not match the above illustration<<<
oFor more information on each function in the dialog, see Appendix section 1.1 AAO Matrix Definitions.
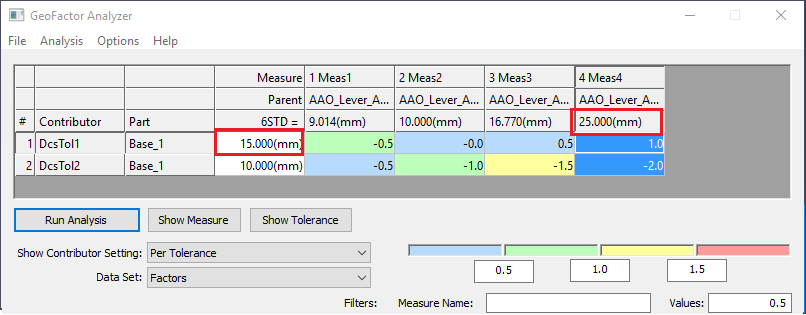
• Click on the [6-Sigma] field for 1 DCSTol1(Base_1) and change the value from 10 to 15 and hit enter.
This is a quick way to see the effect on Measurement range globally by changing a tolerance range.
Note that the measurement's 6-Sigma value updates; for example, Meas4 Range has increased from 22.330 to 24.962(mm).
Also note that the color-coded GeoFactor values will not change.
➢GeoFactor coefficient are calculated based on the locators used in the moves and location of the measurements.
| If these locations do not change the coefficient will not change. |
>>>Your results may not match the above illustration<<<
•Highlight the 4 Meas4 column in the GeoFactor Analyzer Window to view the measure in the graphical window. You may have to minimize the Simulation and GeoFactor Analyzer windows.
•In the GeoFactor Analyzer window, highlight the DCSTol2 row to view the tolerance in the graphical window.
•Click ![]() [Separate] and close all windows and the current AAO_Lever_Assembly model. There is no need to save the model.
[Separate] and close all windows and the current AAO_Lever_Assembly model. There is no need to save the model.
Model 2 Review: AAO_Headlamp_Assembly
GeoFactor Analyzer
•Open the AAO_Headlamp_Assembly in the tutorial folder.
The Tutorial files and the Example Models install to the following default directory:
C:\Users\Public\Public Documents\DCS\3DCS_V5_8_2_0_0\Tutorials\V5MCNXV6CREO_AAO_Tutorial\Headlamp Assembly
• ![]() Nominal Build and
Nominal Build and ![]() GeoFactor Analyzer the Advanced Analyzer Matrix for the Headlamp model.
GeoFactor Analyzer the Advanced Analyzer Matrix for the Headlamp model.
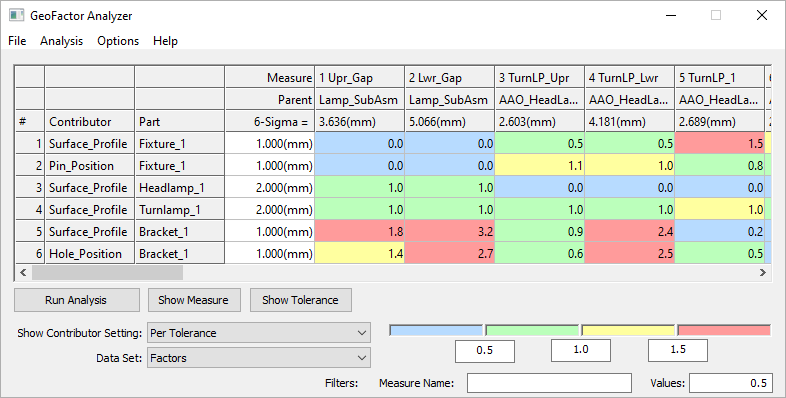
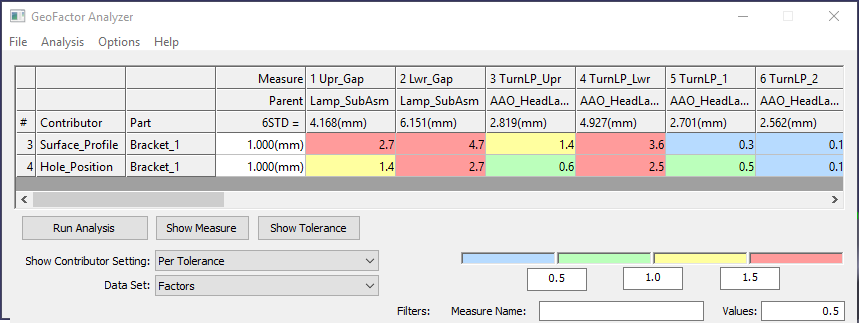
•Click [Run Analysis] to generate the colored chart. Color-coding breakdown is determined by the absolute value of the GeoFactor coefficients (minimum and maximum) globally. Ensure that Factors is selected from the Data Set drop-down.
>>>Your results may not match the above illustration<<<
oYou may notice that some GeoFactor values are the same but color coded differently. That is due to rounding. Click [Options] -> [Display Options] and change the Factor Precision to 10 to see the value differences; change it back to 1 when done.
oContributing tolerances with GeoFactor less than a set value are filtered out of the analysis. This will remove contributing tolerance rows that do not include any GeoFactors over the set value. Click in the Values field and replace it with 2 to change the set value. Contributors aren't deleted by doing this; they're just hidden from the Analyzer Matrix.
oContributing tolerance rows 1, 2, 3, and 4 are filtered out or hidden but color-coding values of the remaining rows will be the same.
>>>Your results may not match the above illustration<<<
oChange the Factors Values filter back to 0
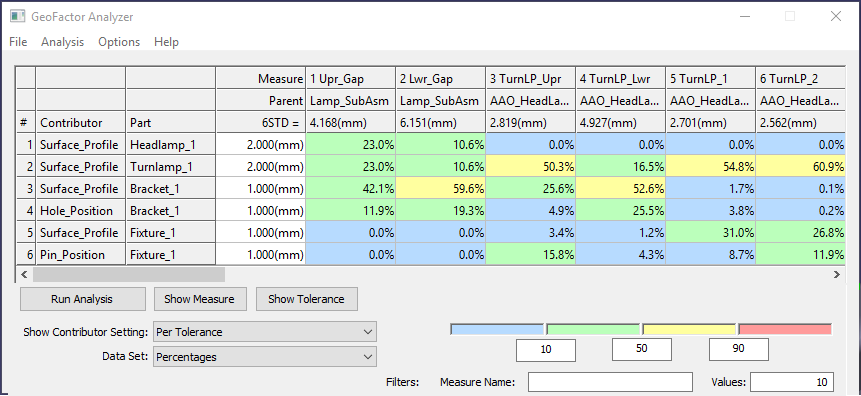
oNow select Percentage from the drop-down next to Data Set. Each tolerance's contributing percentage is shown in the matrix and it is color-coded.
>>>Your results may not match the above illustration<<<
oAgain, you can filter tolerance Percentages by editing the Values field (currently filtering contributors with less than a 10% contribution globally).
oClick and change the values for the color coding. Since there are more factors in this model, you will be able to observe the dynamic color-coding changes in the Matrix.
oChange tolerance range for any tolerance to observe the change in percentage contribution.
•Close model without saving.
Conclusions
The GeoFactor Analyzer is used to enter "what if" tolerance values and immediately see updated measurement results. These can be compared on a full model basis.