![]() Critical Tolerance Identifier (CTI) is a meta-analysis tool that identifies the critical tolerances in a model. CTI quantifies the effect of tolerances and assembly variation on the measurements simultaneously while GeoFactor and HLM calculate each measure separately. True model quality is often thought of as either the sum of the percent-in-spec for each measurement or the percent of samples with no measurements out-of-spec. These statistics do not have a simple relationship to the input tolerances. Therefore, CTI indicates the most (and least) important tolerances. To support various cases, the model results are calculated by four different sensitivity methods, PPK%, PP%, OUT%, and Ave%
Critical Tolerance Identifier (CTI) is a meta-analysis tool that identifies the critical tolerances in a model. CTI quantifies the effect of tolerances and assembly variation on the measurements simultaneously while GeoFactor and HLM calculate each measure separately. True model quality is often thought of as either the sum of the percent-in-spec for each measurement or the percent of samples with no measurements out-of-spec. These statistics do not have a simple relationship to the input tolerances. Therefore, CTI indicates the most (and least) important tolerances. To support various cases, the model results are calculated by four different sensitivity methods, PPK%, PP%, OUT%, and Ave%
Benefits:
oCTI calculates a single percent contribution to indicate how each tolerance affects the whole model. Measures can be weighted by their Pp values, Ppk values, or Percent Out of Spec results.
oCombines AAO, Simulation and HLM/GeoFactor data into a single table.
•Open the AAO_Headlamp_Assembly
•The Tutorial files and the Example Models install to the following default directory:
C:\Users\Public\Public Documents\DCS\3DCS_V5_8_2_0_0\Tutorials\V5SWMCNXV6CREO_AAO_Tutorial\Headlamp Assembly
•Click ![]() [Nominal Build].
[Nominal Build].
•Click ![]() [Run Analysis] icon and run Monte Carlo and Contributors analyses.
[Run Analysis] icon and run Monte Carlo and Contributors analyses.
Note: Either HLM Simulation or GeoFactor can be run for this step.
oCycle through the simulation results to familiarize yourself with the measures and results.
oNote that there are two gap measures while the remaining measures are surface measures located around the trim edges on both the Headlamp and Turnlamp.
oDo not close the Analysis Window
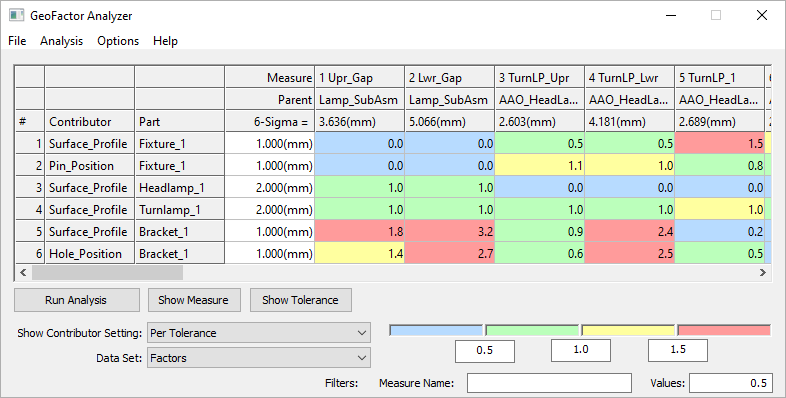
•In the Analysis & Reporting toolbar, click on the ![]() [GeoFactor Analyzer] icon and click [Run Analysis].
[GeoFactor Analyzer] icon and click [Run Analysis].
oClick [OK] to confirm the file path and the Gradient Step value. The matrix will be generated.

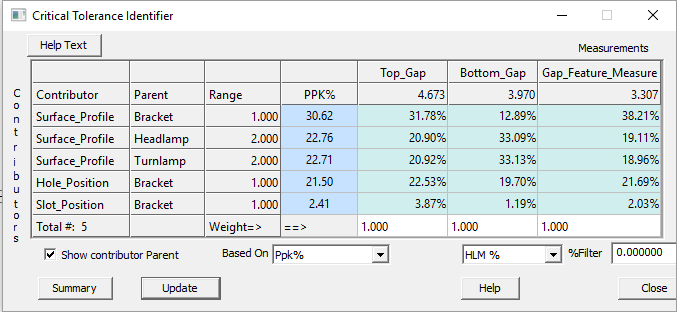
•When the matrix has been generated click on the ![]() [Critical Tolerance Identifier] icon. From this chart you can see the contributing percentage values for all tolerances and measurements, averaged over the whole model and individually per measurement.
[Critical Tolerance Identifier] icon. From this chart you can see the contributing percentage values for all tolerances and measurements, averaged over the whole model and individually per measurement.
oInput fields include the Weight for each measurement.
oResults based on options include Ppk%, Pp%, OUT%, and Ave%.

oFor more information on functions and data in the dialog above, see Appendix section 1.3 CTI Equations.
•View each contributor's Parent part by checking the [Show contributor Parent] box in the bottom left corner of the CTI window.
•Sort contributors based on PPK%.
oNotice that the rows are organized by PPK% in descending order according to the Based On drop-down.
oThe user determines which statistics is most relevant and can sort by PP%, OUT%, and Ave% using the drop-down.
oIf PPK% is the most applicable sensitivity analysis for your model, the highest percentage value indicates the contributing tolerance with the greatest effect on the model and thus the greatest cost to change. Likewise, the lowest percentage affects the model least and, if changed, costs the least relative to changing the other model tolerances.
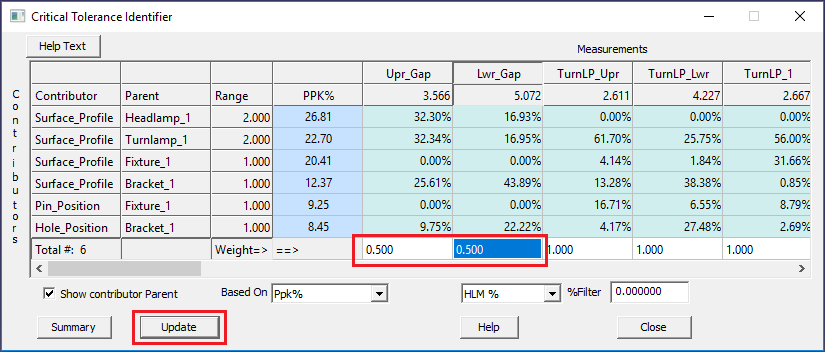
•Adjust the weights of the first two Gap measurements, Upr_Gap and Lwr_Gap, to carry half as much weight as they currently do.
oChange the Weight in Upr_Gap and Lwr_Gap to from 1 to 0.5.
oClick [Update]. When a change is made, the user has to click Update in Critical Tolerance Identifier dialog.
oNotice the values in PPK% adjust accordingly.

•Click ![]() [Separate].
[Separate].
•Close all open dialogs and analysis windows.
Conclusion
The Critical Tolerance Identifier Matrix is used to determine the ranking of tolerance contributors in a model. This Matrix can help identify which tolerances should be edited for better overall cost and quality. Depending on the most applicable analysis method to your model, the highest PPK%, PP%, OUT%, or Ave% contributor impacts the model most. However, CTI also shows those tolerances with low sensitivity percentages that can be loosened with lesser importance to the model and less overall cost. Always be sure to rerun the model with any updates to compare the out-of-spec numbers that help determine the model quality.