|
|
Within this Section:Analysis Settings Monte Carlo options Simulation Axis Simulation Colors Contributor Analysis options Contributor Analysis Colors |
Related Topics:
|
Analysis Options:
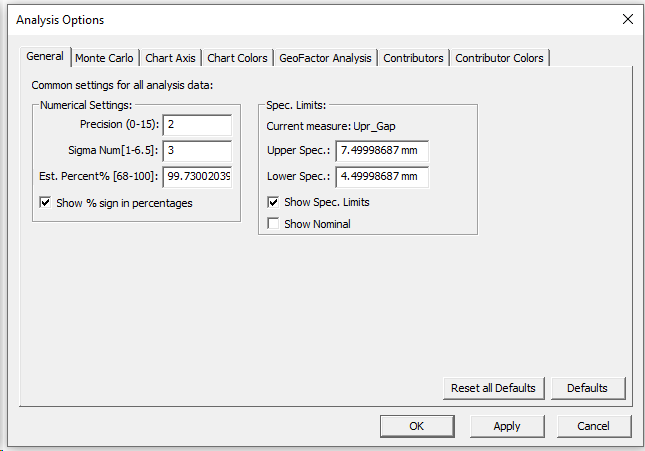
Precision: The number of decimal places shown for each statistical value.
Spec Limits: Specify the Upper and Lower Specification Limits in the fields. These values will appear in the graph window as LSL and USL values.
Show Spec.Limits: Displays the Upper and Lower Spec. Limits for the measurement on the graph.
Show Nominal: Displays the Nominal value for the measurement on the graph.
Sigma Num(1-6.5): The number of plus and minus Standard Deviations displayed in the histogram.
Est. Percent% [68-100]: The percentage of measured samples to fall within displayed limits.
Show % sign in percentages: Displays the percentage values along with % symbol.
Sigma Number and Estimated Percent are directly related to each other. When one value is modified, the other will automatically update. |
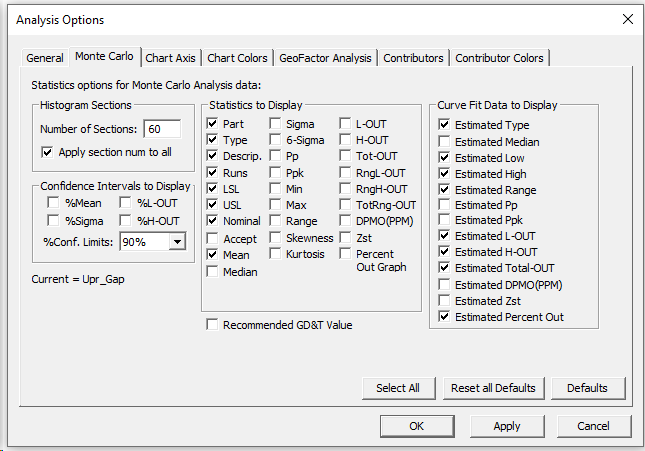
Number of Sections: The number of sections that would fill the Histogram area (default color light blue) of the Analysis window from left to right. 3DCS scales the charted histogram inside this area with some unpopulated area on each side. Therefore, the number of sections in the histogram is usually less than the number of sections specified. If the specified number is large, the number of sections will be many, and the histogram will more closely follow the true measured data.
Apply Section Num to All: Checking this box applies the "Number of Sections:" value to all the measurement histograms. Leaving it unchecked will apply it only to the currently displayed histogram.
Statistics Settings: Displays each statistic on the Simulation Window. See Simulation Output for details.
Select All: Turns on all statistics under Statistics to Display, Confidence Intervals to Display and Curve Fit Data to Display.
Defaults: Turns on only default statistics.
Reset All Defaults: Resets all options in all tabs to their default setting.
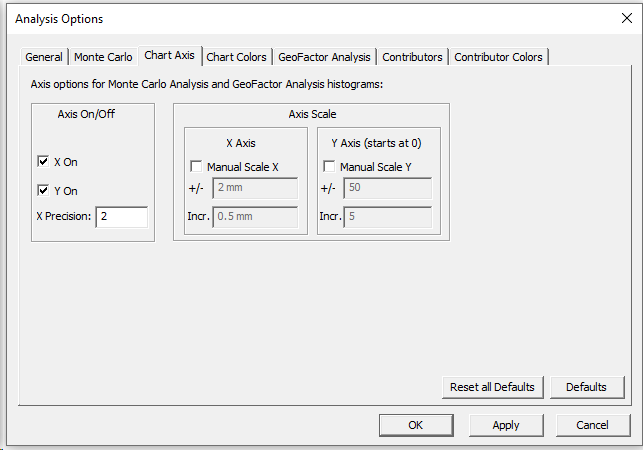
Axis On: Checking X On or Y On check box will display the X or Y axis on the histogram.
X Precision: Precision setting for the X axis of the histogram.
Axis Scale: Manual or Auto scaled X or Y may be set. User input for +/- and Increment is required for Manual scale mode.
Default: Resets all the settings and values to the default configuration.
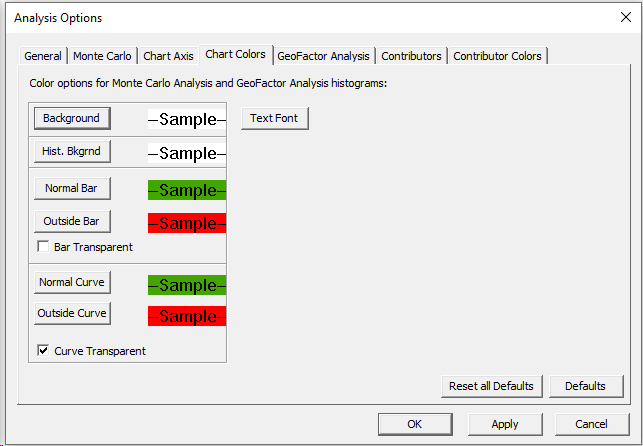
Text Font: Color and Type of the Text for the displayed Statistics
Background: is the background color of the page.
Histogram Background: is the background color of the Histogram.
Normal Bar: Normal Bar is the color of the bars within the histogram that are within specification.
Outside Bar: Outside Bar is the color of the bars within the histogram that are out of spec.
Bar Transparent: Selecting this option will only draw the outline of the histogram bars with no fill color.
Normal Curve: Normal Curve is the color of the bars within the histogram that are within specification.
Outside Curve: Outside Curve is the color of the bars within the histogram that are out of spec.
Curve Transparent: Selecting this option will only draw the outline of the distribution curve with no fill color.
Default: Resets all the settings and values to the default configuration.
GeoFactor Equation-Based analysis options:
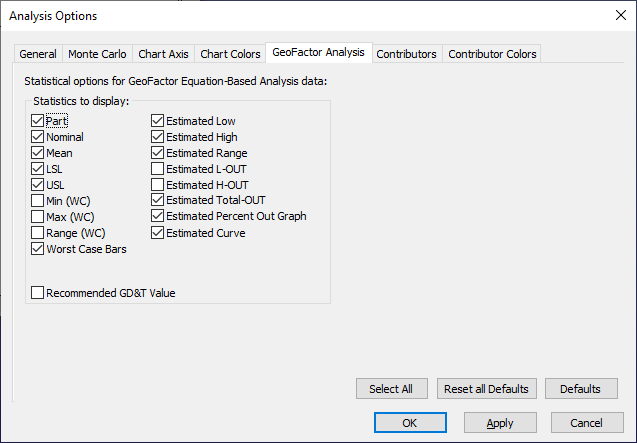
Part: Displays the name of the part associated with the contributing tolerance in the Contributor Analysis report.
Nominal: The Nominal value of the measurement is the value when all tolerances associated with the measurement are at their nominal values and all moves have been performed.
LSL: LSL is the Lower Specification Limit number set for that particular measurement.
USL: USL is the Upper Specification Limit number set for that particular measurement.
Estimated Low: For the Normal and Pearson curves the Estimated Low is selected so that .135% of the area under the curve is in the lower tail.
Estimated High: For the Normal and Pearson curves the Estimated High is selected so that .135% of the area under the curve is in the upper tail.
Est. Range: The Estimated Range is the difference between the Estimated High and Low values. In the case of the Normal curve, this range corresponds to +/- 3 sigma interval.
Est.L-OUT%: The Estimated Low Percentage Out of Spec is the percentage of the estimated curve that falls below the specified Lower Spec. Limit.
Est.H-OUT%: The Estimated High Percentage Out of Spec is the percentage of the estimated curve that falls above the specified Upper Spec. Limit.
Est.Tot-OUT%: The Estimated Total Percentage Out of Spec is the percentage of the estimated curve that falls below the specified Lower Spec. Limit and that falls above the specified Upper Spec. Limit.
Mean: The mean or average value of the population generated by the process simulation.
Min (WC): Minimum value of the measurement generated for that particular measurement.
Max (WC): Max is the maximum value of the measurement generated for that particular measurement.
Range (WC): Displays the effective worst case range of the contributor.
Worst case Bars: Displays the Min Max Worst case values in the graph as Bars.
Estimated Percent Out Graph: (Analysis Summary only) Displays a bar in the Analysis Summary table, duplicating the GeoFactor graph.
Estimated Curve: (GeoFactor Equation-Based graph only) Displays the color graph/bell curve in the GeoFactor Equation-Based analysis window.
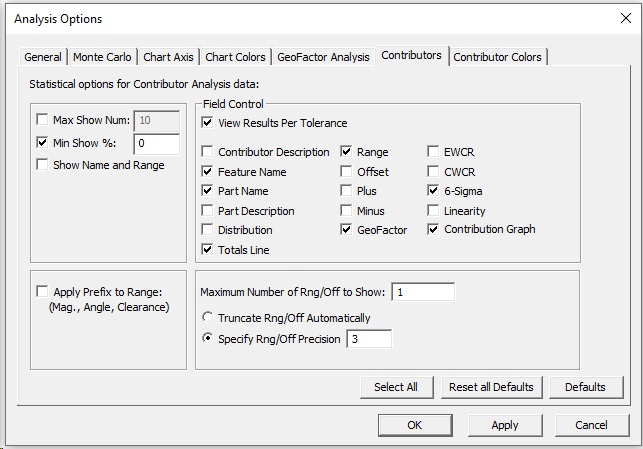
Max Show Number: The number of measurement contributors to have their information displayed.
Min Show %: Shows the contributors based on the percentage (Ex: 5% will show everything from 5% and higher).
View Results Per Tolerances: Toggle the Contribution display per Tolerance or per Feature.
Feature Name: Displays the name of the point associated with the contributing tolerance in the Contributor Analysis report.
Part Name: Displays the name of the part associated with the contributing tolerance in the Contributor Analysis report.
Range and Offset or Plus and Minus Fields: Displays the contributing Tolerance's Range and Offset or Plus and Minus in the Contributor Analysis report. The menu you get is controlled by the Rng/Off Format drop-down list.
Contributor Description: Displays the description of the contributing Tolerance in the Contributor Analysis report.
Part Description: Displays the description of the part associated with the Tolerance in the Contributor Analysis report.
Distribution: Displays the assumed distribution of the tolerance.
GeoFactor: Ratio of change in the Tolerance to the measure. The closer the G-Factor value is to zero, the less the tolerance contributes to the measure.
Mean Shift: Displays the mean shift value for each contributor
Calculation for Meanshift = Offset x Geofactor
Mean Shift Graph: Displays a bar graph of the mean shift values for each contributor, providing a visual comparison across all contributors.
Linearity: Calculates the percentage of linear contribution for each factor, indicating the contributors that have a nonlinear effect on the measurement (the contributors that show a low value for the Linear Ratio). See Linearity topic for more information.
6 Sigma: Displays the effective 6 Sigma value of the contributor. The 6 Sigma = Standard Deviation of the (Range*GeoFactor*6). This is a simplified equation for linear tolerances, Positional/Circular Tolerances, Bonus and HP Position have a more complicated equation.
Estimated Worst Case Range (EWCR): Displays the effective worst case range of the contributor. The EWCR = GeoFactor*Range.
Note: Depending on the display mode (Per Tolerance or Per Feature) and Bonus tolerance, the EWCR could show unexpected results. For best results, show the Contributor results with Per Feature mode set. If any Bonus tolerance exist, the EWCR result could be slightly higher.
Contributing to Worst Case Range (CWCR): Displays the Contributing worst case range of the contributor.
Apply Prefix to Range: This option will put the type prefix in front of the Range value. For example, in the Range column in the picture below, "M:" is placed before the Range Magnitude.
Contribution Graph:This option will create a pseudo bar cart after the Percent column to graphically show the percent contribution of the given tolerance. See the picture below with percentage bars shown.
Text Justify: Click the appropriate radio button to justify the text to the Left, Center, or Right.
Maximum Number of Rng/Off to Show: Some tolerances in the 3DCS model may have more than one random number to tolerance a point. For example, a circular tolerance can have two random numbers: Magnitude and Angle. A Triple tolerance has three random numbers to deviate the part in three directions. A User DLL tolerance can have as many random numbers as a user wishes.
These random numbers are displayed in the Contributor Analysis window's Range column. Only the number of Random numbers specified in the ...Rng/Off to Show option will be displayed. For example, if a triple tolerance was a top contributor to a Measurement, and the ...Rng/Off to Show option is set to a value of only 1, then only the first random number will be displayed and the second two random numbers would be omitted.
Truncate Rng/Off Automatically or Specify Rng/Off Precision: This option is used to truncate the number of digits displayed for values in the Range column. Using the first option will truncate the values automatically. Using the second option will allow the user to set the precision.
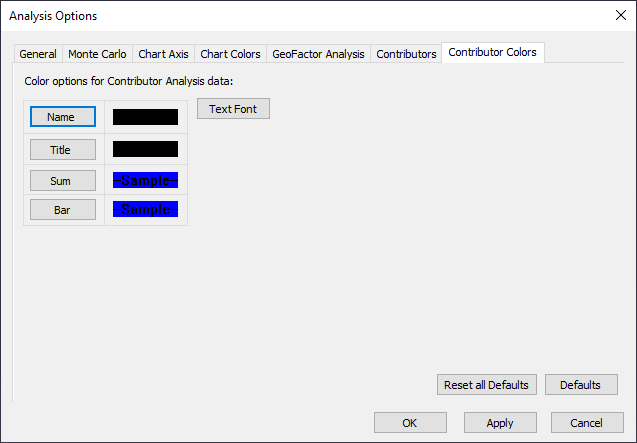
Contributor Colors
Text Font: Color and font of the Text. Background: Background is the background color of the page. Name: Color of the Measurement Name and Description. Title: Color of the Tolerance headings. Sum: Color of the Sum of Rest of Contributors not displayed. Bar: Color of Percentage Bars. Default: Resets all the settings and values to the default configuration. |
