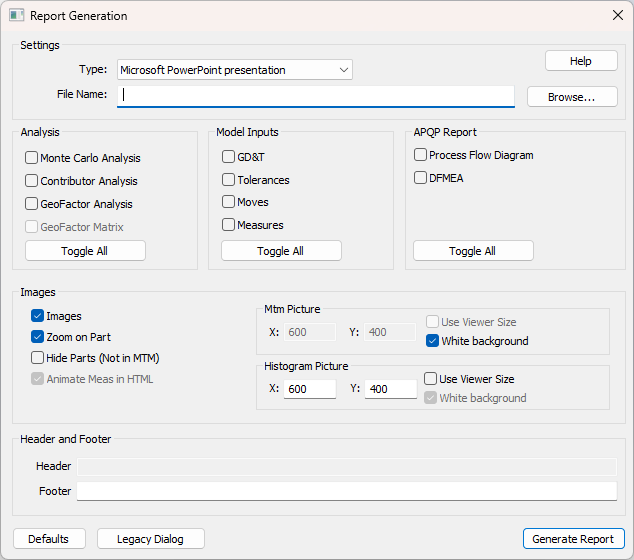
Users can create a 3DCS Report using Power Point. Each Move, Tolerance, Measure views; Monte Carlo analysis, Contributor Analysis, GeoFactor Equation-Based, and Advanced Analyzer and Optimizer results can be added to the report. Users can also add a Model Summary and Parts notes to add more detail to the report.
|
|
Within this Section:Procedure |
See Also:Creating a Power Point report (Community) |
How to create a Power Point report:
1.Open a completed 3DCS Tolerance Analysis model
2.Nominal Build and run a new Simulation
oUsers can edit the report options while in the Simulation dialog by selecting the [Generate Report] check box and then selecting [Report Options].
oTo save or edit the report, open the Generate Report dialog.
3.Leave the Simulation Window open.
4.Select the Power Point (*.pptx) option at the bottom.
5.Select [Generate Report], or OK and run the Simulation.

Editing the Power Point template (Custom Report):
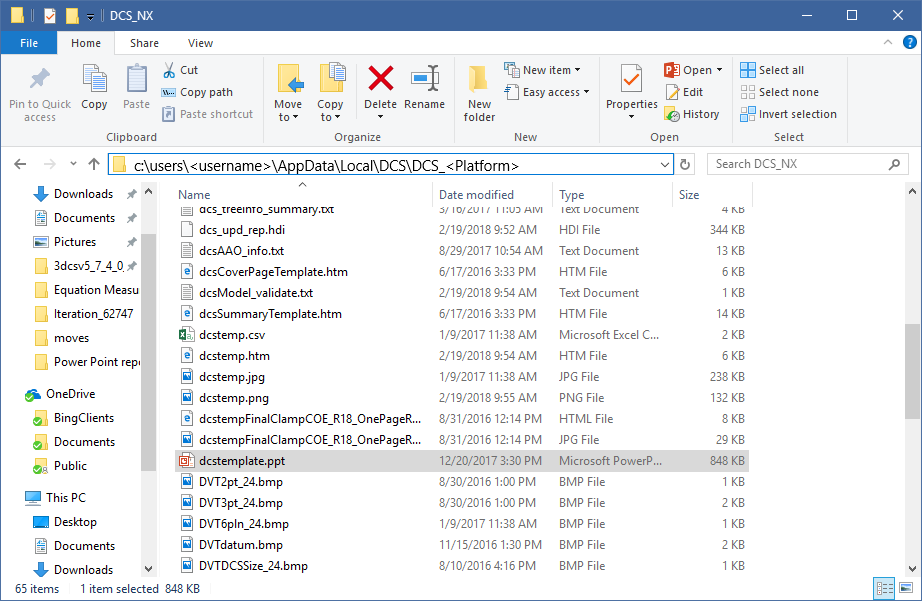
3DCS will create a template of the Power Point report for the software to easily add images, Analysis results, and more. Users can edit the template as well, adding a background or theme, company logos, moving Move, Tolerance and Measure images or moving the tables for the Analysis results.
Requirements:
•The template (dcstemplate.ppt) needs to remain the same name and in the same location.
•Deleting any of the pages or required image holders may result in missing images or text.
If a user needs to modify the Power Point template, navigate to the AppData folder: C:\Users\<username>\AppData\Local\DCS\DCS_V5. The file is called dcstemplate.ppt.
Open the template in Power Point, and if changing or saving the template, it is required to save the report as dcstemplate.ppt and in the same folder. Otherwise, 3DCS will create a new template and not use the customized report.
