After running a Monte Carlo analysis and/or Contributor Analysis, the Analysis Report window will appear. In the Simulation Window, the user can scan through the model's measurements, hide/show the Monte Carlo analysis or Contributor Analysis; edit Tolerances or Measurements, and more.
Menus within this dialog:See also: Simulation Output and Sensitivity Output for an explanation of all measured outputs. For the Pros, Cons and Assumptions of this analysis method see Analysis Comparison & Assumptions. |
Analysis Table View |
|
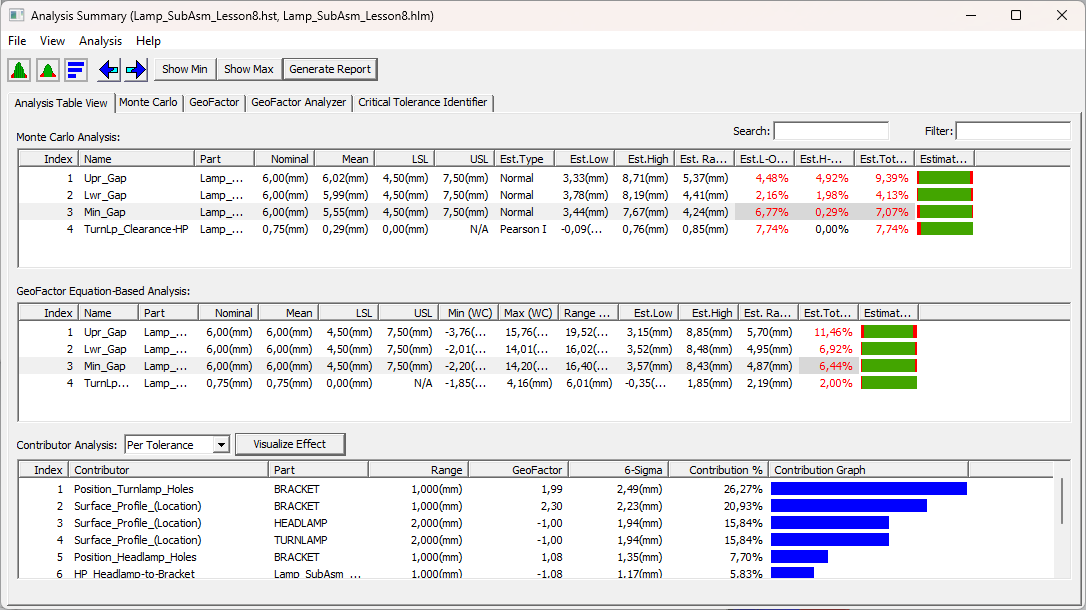
The Analysis Summary shows all the Monte Carlo, GeoFactor, and the Contributors results.
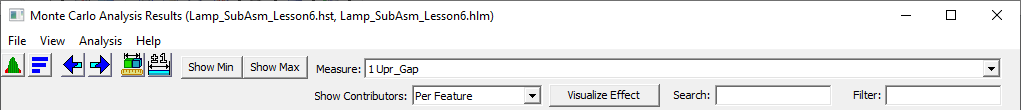
Users can: ➢Double-click on one of the measures in the Monte Carlo Analysis or GeoFactor lists, to see the their specific results in a Histogram or Graph. oDouble-click a Contributor to open the Tolerance or GD&T dialog. ➢Select a Contributor and select [Visualize Effect] to view the deviation of the specific tolerance. ➢Add or Remove outputs. Go to View -> Options. Either Monte Carlo, GeoFactor Analysis, or Contributors tabs will impact the Table View and the specific tabs. ➢Search for specific values; or Filter only specific values, minimizing the view of the results. ➢Switch the Contributor Analysis view between Per Tolerance or Per Feature to view which tolerances affect the results. |
|
Monte Carlo Analysis |
|
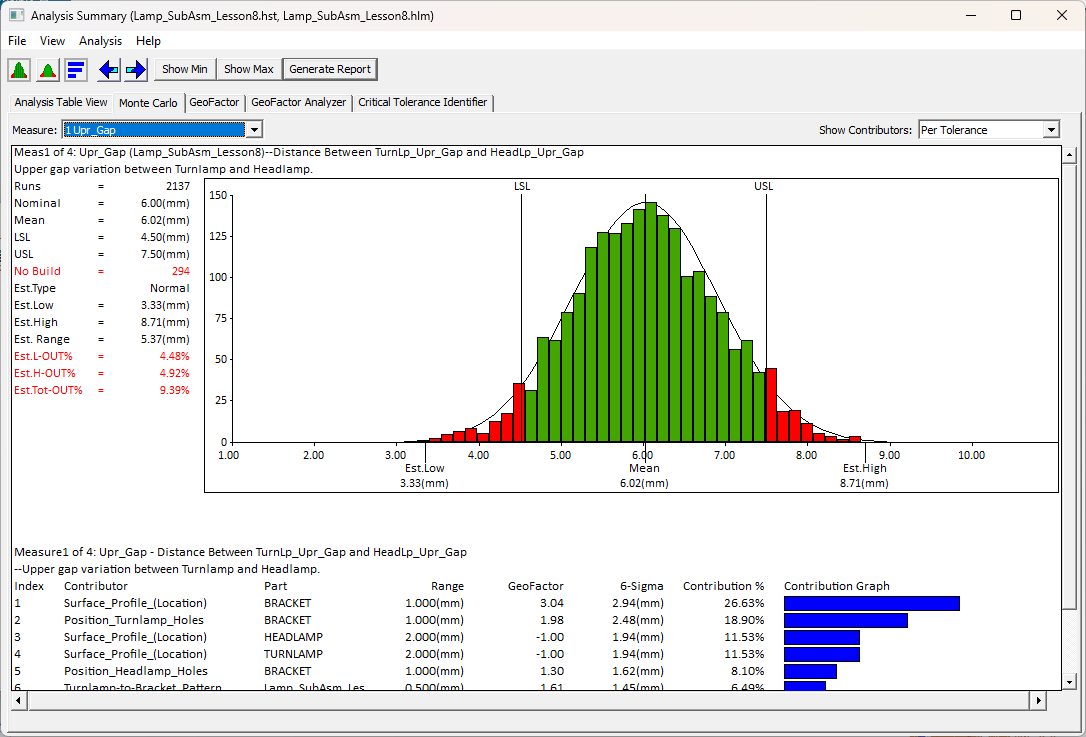
The Monte Carlo results (Histogram) shows the statistical results of the measure.
Users can: ➢Add or Remove outputs. Go to View -> Options. Select the Monte Carlo, Chart Axis or Chart Colors tabs. oUsers can activate the Min, Max and Range options when viewing the Circle Interference and Virtual Clearance measures results. ➢Use the Measures drop-down list or the ➢Display the RAW data based on a Seed and current Measure, by going to View -> Show Samples. ➢Drag the USL and LSL lines to see the Estimated results change. This can also be manually entered by going to View -> Options -> General tab. The USL and LSL values can be seen and edited here. This doesn't impact the measures; re-run the Simulation to reset the Measure Spec Limits. |
|
GeoFactor Equation-Based Analysis |
|
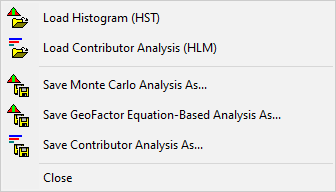
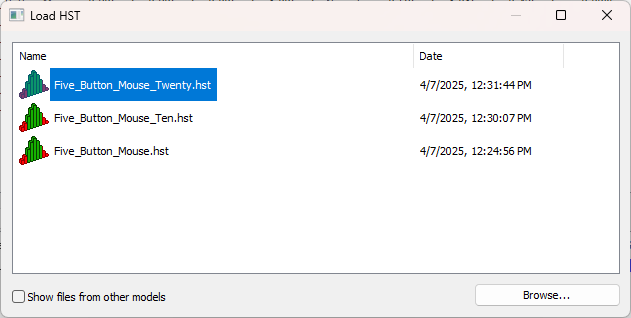
![]() Load Histogram (HST): opens a dialog list of recently saved HST files from the current model.
Load Histogram (HST): opens a dialog list of recently saved HST files from the current model.
•Show files from other models: Expands the recent file to load to today's models, even different from different models.
•Browse...: Opens the Window Explorer dialog to allow selecting any HST file.
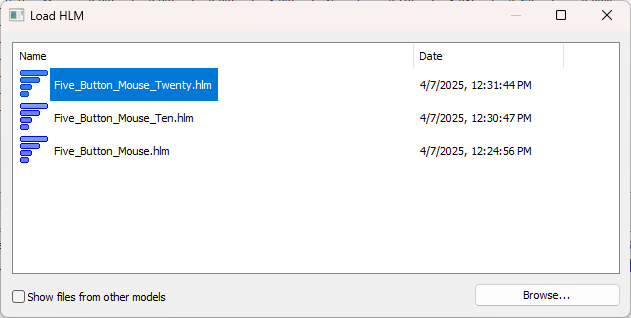
![]() Load Contributor Analysis (HLM): opens a dialog list of recently saved HLM files from the current model.
Load Contributor Analysis (HLM): opens a dialog list of recently saved HLM files from the current model.
•Show files from other models: Expands the recent file to load to today's models, even different from different models.
•Browse...: Opens the Window Explorer dialog to allow selecting any HLM file.
![]() Save Monte Carlo Analysis As (HST) will save the *.hst file in the Model's Report Directory (as default location). Please see Saving Histogram Data for a detailed layout and available file types.
Save Monte Carlo Analysis As (HST) will save the *.hst file in the Model's Report Directory (as default location). Please see Saving Histogram Data for a detailed layout and available file types.
![]() Save GeoFactor Equation-Based Analysis As will save the results as a StatRow (CSV) file in the Model's Report Directory (as default location).
Save GeoFactor Equation-Based Analysis As will save the results as a StatRow (CSV) file in the Model's Report Directory (as default location).
![]() Save Contributor Analysis As (HLM) will save the *.hlm file in the Model's Report Directory (as default location). Please see Saving Contributor Analysis Data for a detailed layout and available file types.
Save Contributor Analysis As (HLM) will save the *.hlm file in the Model's Report Directory (as default location). Please see Saving Contributor Analysis Data for a detailed layout and available file types.
Variants This drop-down tab will switch the Analysis results display for the selected Variant.
View
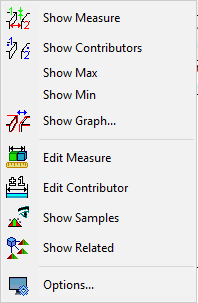
![]() Show Measure displays the current measure on the model in the Graph window. Only available in Analysis Results Window.
Show Measure displays the current measure on the model in the Graph window. Only available in Analysis Results Window.
Show Min/Show Max shows the current measures min or max output in the graph window.
![]() Show Graph shows the selected assembly positions for a model.
Show Graph shows the selected assembly positions for a model.
![]() Show Contributors selects and shows the Contributor Analysis index points on the model, in order to view where the index points for the results are located on the model. Only available in Analysis Results Window.
Show Contributors selects and shows the Contributor Analysis index points on the model, in order to view where the index points for the results are located on the model. Only available in Analysis Results Window.
![]() Edit Measure will open the current measure. Only available in Analysis Results Window.
Edit Measure will open the current measure. Only available in Analysis Results Window.
![]() Edit Contributor will display a list of available tolerances or GD&T. Only available in Analysis Results Window.
Edit Contributor will display a list of available tolerances or GD&T. Only available in Analysis Results Window.
![]() Show Samples allows the user to view a particular build selected from the simulation results.
Show Samples allows the user to view a particular build selected from the simulation results.
![]() Show Related will open the Related List for the selected measurement in an HTML format.
Show Related will open the Related List for the selected measurement in an HTML format.
![]() Options allows the user to customize the report options for Monte Carlo analysis and Contributor Analysis.
Options allows the user to customize the report options for Monte Carlo analysis and Contributor Analysis.
Analysis Commands and Functions:
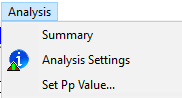
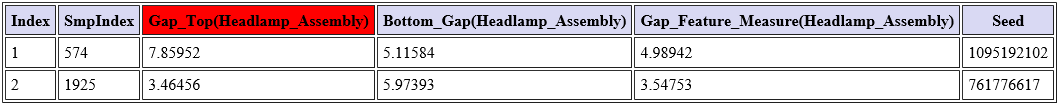
Summary: Also referred to as Sample Summary, displays the current measure's samples, min and max values, as well as all other measure's samples, min and max values, at the current measure max and min.
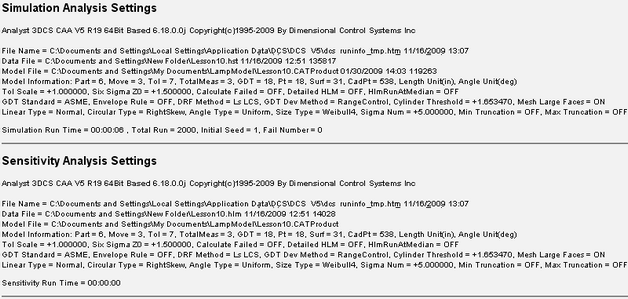
Analysis Settings: Displays all the settings used in the model; model and data location; simulation run time information, and much more.
Set Pp Value: Allows the user to change the current measurement output by inputting a Pp Value.
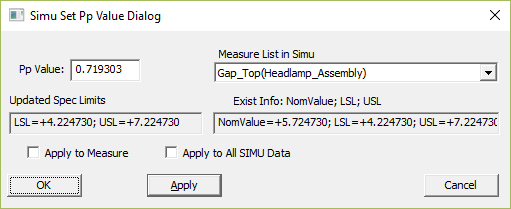
Apply to Measure: Edit the Pp Value and apply will apply the new Pp Value to the current measure in the Simulation.
Simulation Window layout
![]() Hide/Show Histogram: Hides or shows the Histogram and Statistical Information in the Simulation Window.
Hide/Show Histogram: Hides or shows the Histogram and Statistical Information in the Simulation Window.
![]() Hide/Show Contributor Analysis: Hides or shows the Contributor list in the Simulation Window.
Hide/Show Contributor Analysis: Hides or shows the Contributor list in the Simulation Window.
![]() Next and
Next and ![]() Previous buttons allow the user to view the outputs of the next or previous measures.
Previous buttons allow the user to view the outputs of the next or previous measures.
![]() Edit Measure: will open the current measure.
Edit Measure: will open the current measure.
![]() Edit Contributor: will display a list of available tolerances or GD&T.
Edit Contributor: will display a list of available tolerances or GD&T.
Show Contributors: This option shows the Contributor list by either the Tolerance or Feature.
•Per Tolerance: Only shows the Tolerance as a contributor. Even if the Tolerance or GD&T have more than two features selected.
•Per Feature: Shows all of the Features of the tolerance as a contributor.
Search: Search a measure in the results window by name. This function will automatically go to the first measure it finds with the typed name. (Example: "Meas" shows the first measure with "Meas" in the name). (Wild cards "*$#@%^" are supported).
Filter: Filter measures in the model by name. This function will only list measures in the results with the typed name. (Example: "Gap" will only list measures with "Gap" in the name). (Wild cards "*$#@%^" are supported).
Show Min/Show Max: shows the current measures min or max output in the graph window.