Using the GeoFactor we are able to calculate the Worst Case (WC) impact of each individual input for the model. Summing these inputs can give us the overall Worst Case limits of a measure. In the GeoFactor tab of the Analysis Options dialog the Min (WC), Max (WC), and Range (WC) can be activated to have the GeoFactor Analysis results also report the WC numbers.
For more information about GeoFactor, see the previous section Explaining GeoFactor.
|
3DCS Monte Carlo simulations return to us the statistical results for our analysis, however in order to see the Worst Case (WC) of a measure we would have to run a very large amount of Monte Carlo simulations and probably adjust distribution types to increase the likelihood that the WC build has appeared in our population of data. This can be a time consuming and imprecise method to finding the WC. However, leveraging the GeoFactor value we can easily calculate the anticipated WC using an equation.
Range*GeoFactor = Contributor WC Range
If we take a simple summation of all of the Contributor WC Ranges then we will find the overall WC Range for the measure.
∑(Contributor WC Range) = Measure WC Range
Worst Case vs. RSS Example
As an example, let's say you have this example of a Jumper (blue part) and an Insert (clear green part) and you want to measure the distance from the bottom face of the Insert to the upper hole on the Jumper:
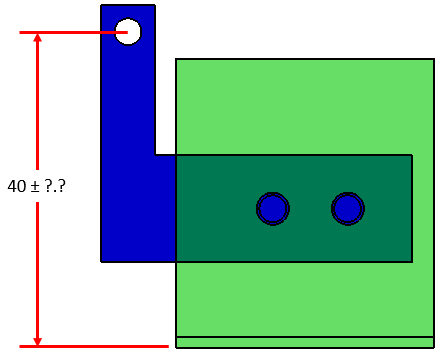
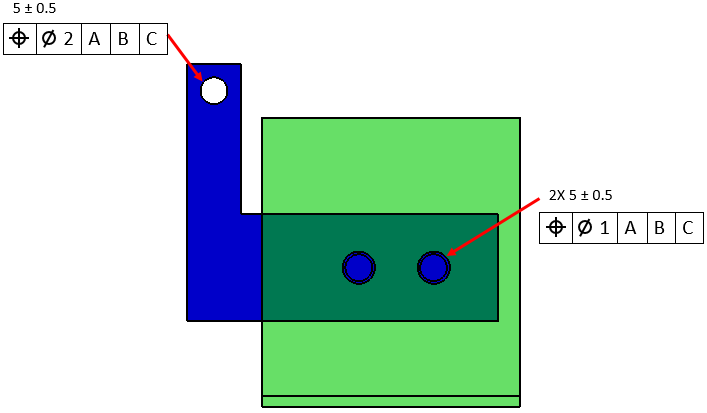
For this example, we will assume the holes are press fit or rivets and therefore won't have any clearance to consider. We will also say that the pins of the Jumper and the lower face of the Insert are Datums and don't have variation we need to consider. So, the only variation we are considering will be the Position tolerances of the Insert holes and Jumper hole. Note: While both these are shown on an assembly image, they are meant to represent the individual part tolerances for each of these holes.
It is easy to see that this won't be a completely straightforward task without the help of some software. For one thing, with only the image to work from it is difficult to determine what the impact of the positions of the two locating holes will be without creating some measures within our geometry to understand how far the holes are apart and how far each hole is from the Jumper hole we are taking the measures at. Fortunately, 3DCS handles all the geometric relationships such as this and gives us the GeoFactor for each Feature.
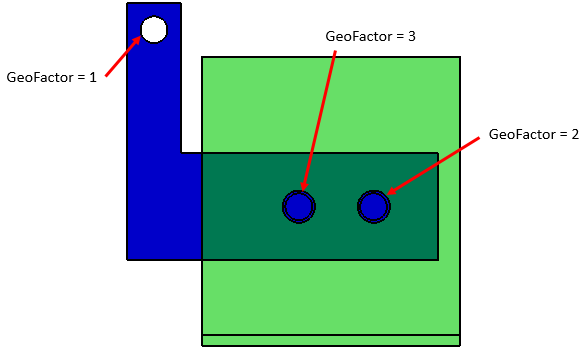
Taking the input range and GeoFactor, 3DCS can individually calculate the Contributor WC Effect for our three tolerances then sum them up to see the Measure WC Range. Also included, for comparison, is the Measure RSS Range for this three contributor analysis:
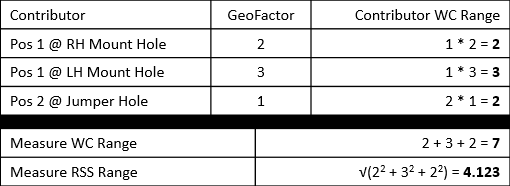
Measure WC: 40 ± 3.5
Measure RSS: 40 ± 2.062
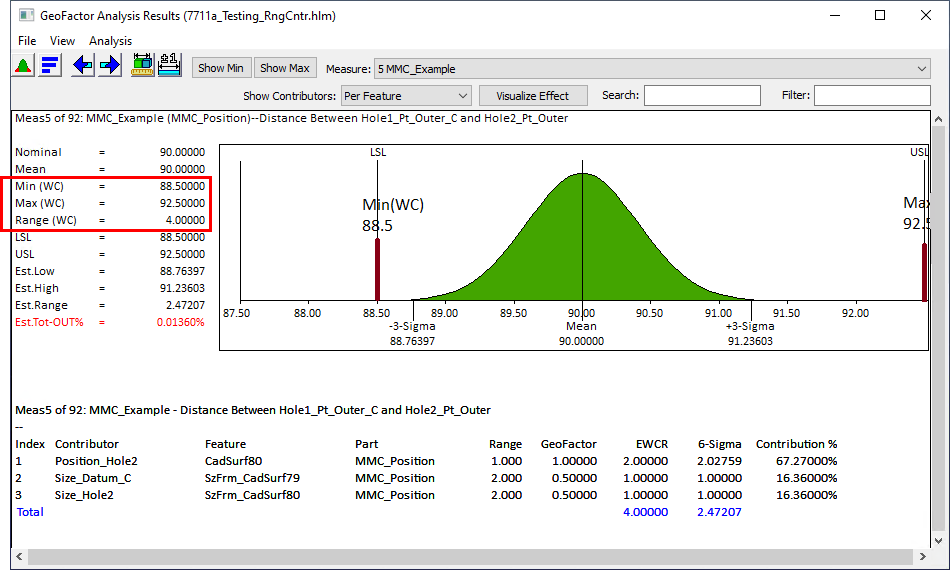
These numbers match the numbers that 3DCS will return us:
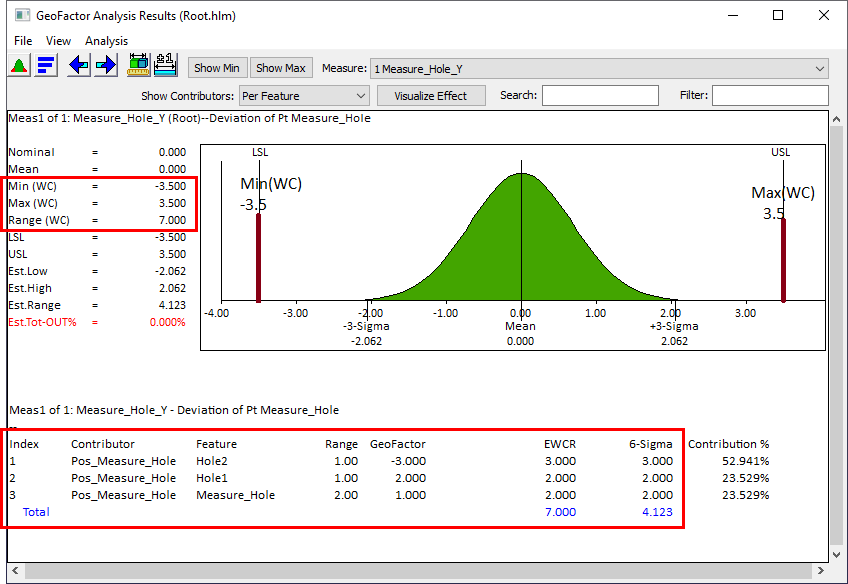
Notice that with only three significant contributors we still have a WC that is much larger than the RSS range typically used in a statistical dimensional engineering project.
The Worst case value will also be displayed in the Analysis Histogram Graph in bars.
Exceptions for WC Analysis
As mentioned above, the WC Analysis is individually checking the effects of each tolerance and then summing those effects together. This becomes a problem if we have the Size tolerance of a Pin/Hole or Tab/Slot directly contributing to a measure and also have one of the three following contributing as well:
1.The Position Tolerance of that Pin/Hole or Tab/Slot if there is the tolerance has the MMC or LMC modifier on it.
2.Another GD&T that uses that Pin/Hole or Tab/Slot as a Datum if there is the MMB or LMB modifier on it.
3.A float that uses that Pin/Hole or Tab/Slot.
Each of the above circumstances is reliant on the size of the Pin/Hole or Tab/Slot to determine how much Bonus, Datum Shift, or Float is available to arrive at WC. This can best be explained in another example, this time using a simple block that has two holes and a Position Tolerance on one of the holes.
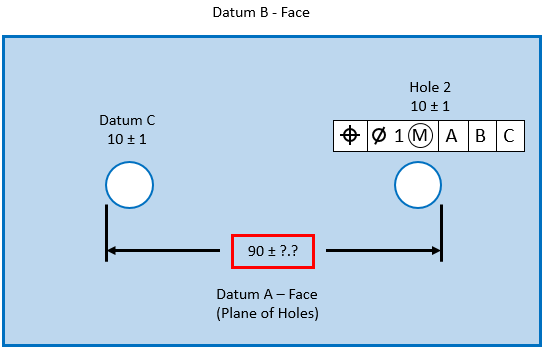
For this example we are trying to measure the distance from the leftmost edge of the left hole to the rightmost edge of the right hole. We'll have three total contributors: the sizes of the two holes and the Position tolerance on Hole 2 (which dictates the distance between the centers of the two holes). The complication with this analysis from a WC perspective is that there is a potential Bonus to consider for the Position tolerance. If we list out the three contributors (with bonus broken out) similar to how we did above it will look like this:
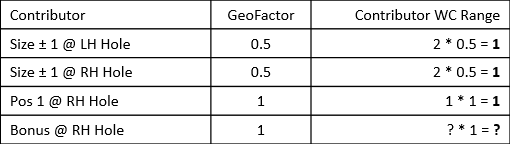
Now because this is a WC analysis we are performing, it is tempting to simply set the Bonus to maximum to give the maximum variation. However, the Bonus is contingent on another contributor in the list: the size of the RH Hole. If we are trying to maximize the length of the measure, then we will maximize the size of the RH Hole (Hole @ LMC) which will also maximize the Bonus available to shift the center of the hole farther to the right hence maximizing the measurement. However, if we want to minimize the measure, then we will minimize the size of the RH Hole (Hole @ MMC) which will mean that we are also decreasing our Bonus to zero. Now another option would be to put the RH Hole @ LMC to maximize the Bonus. Both of these options will return the same result because the amount we increase the hole by will also increase the amount that we can move the center of the hole to the left. No matter the size of our RH Hole, the furthest left that the edge of the hole can be is set by the Virtual Condition. This concept is shown in the image below:

This means that the Bonus will only really come into play when trying to find the WC maximum. This also means that we should break this problem up into two parts: a WC maximum contributor list and a WC minimum contributor list. We will start with the WC maximum (Note: ranges are cut in half to show that we are only looking at these moving in the direction that will increase the distance):
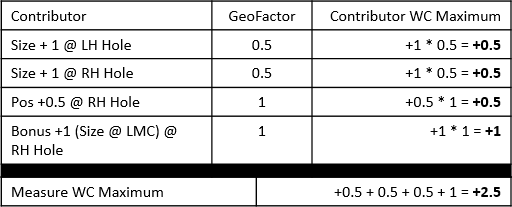
Notice that the RH Hole is @ LMC so the Bonus is at a maximum. Now let's look at the Contributor list for the WC minimum:
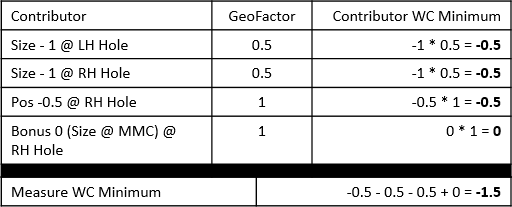
For this WC analysis we took the RH Hole at its MMC which also reduced the Bonus to zero. However, remember from above that the WC minimum is actually independent of size. This same answer can be reached by setting the RH Hole to its LMC:
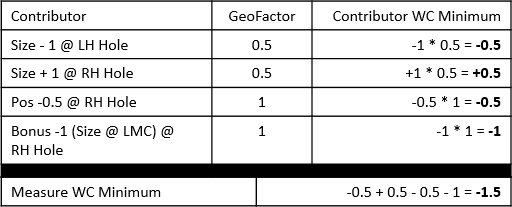
By changing the size from -1 to +1 we maximized our Bonus, but we also changed it such that the Size tolerance was now increasing the measured distance rather than decreasing it. Therefore even with the Bonus we still end up at a WC minimum of -1.5.
We end up with asymmetric boundaries for our WC maximum and WC minimum in this scenario. Therefore our boundaries for our WC analysis are:
90 +2.5/-1.5
Fortunately, if we set up this exact situation in 3DCS the WC analysis which typically investigates one contributor at a time will recognize the link between the Hole Size and the Bonus and return accurate results.
This example only covered the MMC condition, but this same concept works for any analysis that sees a Size tolerance show up in the contributors with any of the three scenarios outlined above.
Note:
A position tolerance (applied as 100% orientation) shows a WC Range equal to the tolerance range, with no contributors. The same measure shows zero value for WC when perpendicularity is applied instead of the orientation.
The reason for this is because we want to make sure that the WC for position tolerance includes the case where the position tolerance is applied as a location using the tolerance full range. Being a WC calculation, it is possible to have that scenario, even if statistically the entire tolerance is applied as orientation only.