The Report Generation feature automatically creates a report for the 3DCS model and can export it in an HTML, PPT, Excel, Google Docs, Google Slides or Google Spreadsheet format. The report consists of model information, pictures and details of inputs and outputs, direct interfacing to Microsoft Word for model summary and MTM details. An automated report can be created prior to or after running the simulation.
To get started, the report structure consists of Move, Tolerance, and Measure views; Cover Page, Summary Page, and part or assembly notes. The user can edit these features to improve the overall look and feel of their report.
While the report can include all aspects of the model, each specific feature can be activated or deactivated; images re-sized for clarity; as well as report detail modifications.
|
|
Topics: |
See Also: |
The Report Pages consist of the Cover Image and Cover Page, the Model Summary and the Part Notes. Each can be edited by the user by right-clicking on a part or assembly, and selecting either Model Summary, Cover Page, or Part Notes. There is also Analysis Page consisting of the Monte Carlo analysis, Contributor Analysis, GeoFactor Equation-Based images; Tolerance page consisting of feature information and tolerance distribution. The Generate Report dialog displays all the pages, images and analysis results, which can then be activated or deactivated.
Models that contain imbedded GD&T or PMI won't display in the GD&T in the images. The users can add images or drawings to the part notes or, a Tolerance or GD&T note. |
Cover Image: Applies the view of the model, exactly shown in the graphics window, on the cover page of the report. When generating a final report, modify the view of the model. It's good practice to Nominal Build to display the assembled model, and shown in an Isometric view. The Cover Image can be edited or replaced within the HTML folder, or deactivated to only show the Cover Page text.
![]() Cover Page: The Cover Page can be edited in 3DCS but cannot be deactivated. This page is the initial page of the report, along with the Cover Image.
Cover Page: The Cover Page can be edited in 3DCS but cannot be deactivated. This page is the initial page of the report, along with the Cover Image.
![]() Model Summary: The Model Summary is a page that summarizes the model information. The Model Summary can be edited through the Analysis Toolbar, under Generate Report sub-menu, or by right-clicking on a part, assembly or root nodes. If no previous Model Summary exists in the model, a template will be displayed when this option is selected. This template can be modified as needed by the user.
Model Summary: The Model Summary is a page that summarizes the model information. The Model Summary can be edited through the Analysis Toolbar, under Generate Report sub-menu, or by right-clicking on a part, assembly or root nodes. If no previous Model Summary exists in the model, a template will be displayed when this option is selected. This template can be modified as needed by the user.
![]() Part Note: Part Notes are individual notes for each part users can create in Word or Google Doc.
Part Note: Part Notes are individual notes for each part users can create in Word or Google Doc.
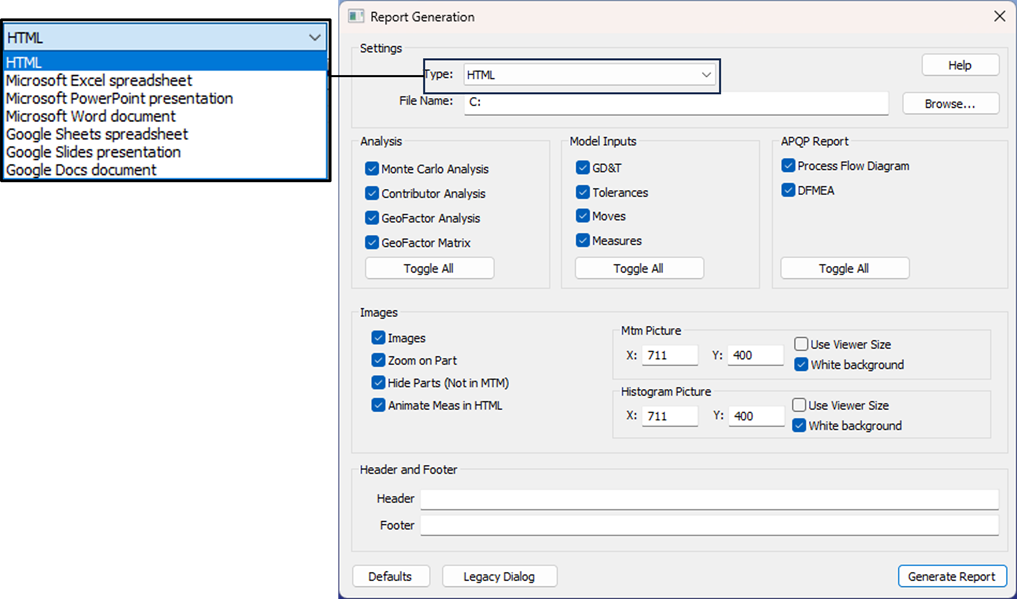
Report Images setup: Moves, tolerances, measures, and GD&T all contain views that the user can use and edit to display in their model's report. The images can be activated or deactivated to hide or show the images in the report.
Report Type: Users can create a different file type to display a report. The types of files are HTML, Microsoft Excel, Word, Power Point or Google Workspace. Power Point Reports can be edited before, to add a company water mark, background images, or move around the template images, etc.; and after to move the Monte Carlo analysis, Contributor Analysis, GeoFactor Equation-Based or other Report generated images. (Note: The GeoFactor Analyzer grid will not be created for PPT, Word, or Google Slides and Google Docs.).
Model Inputs: These inputs will create individual pages for GD&T, Tolerances, Moves, and/or Measures. If some of these are turned off, the page will not be created. If the Measures are turned off, the Measure results will not be shown.
Analysis Availability: A Report can be created before or after Simulation has been generated. If the Simulation results are not available, only images, Model Summary, Cover Page and Parts Notes will be visible in the Report. After running a Monte Carlo analysis, Contributor Analysis, GeoFactor Equation-Based, the results can be viewed within the Report. The Analysis dialog will need to be open to create these pages.
APQP Report: Adding these options will create a Process Flow Diagram pages (1 & 2) and DMFEA page.
Image: Activates or deactivates the images. This option will create the images for all MTMs, and GD&T, if active.
Zoom on Part: this option will zoom into the part while activate. Deactivating this option will zoom the images into the MTM's point or vector direction, regardless of the part's size.
Hide Parts not in MTM: this option will hide parts that are not within the MTM's object or target lists.
Picture Size:Picture size generation and visualization can be modified by this section. The X and Y values determine the overall width and height respectively of each picture (X=600 and Y=400, by default), which is based on pixels. The minimum width value that can be entered in 200. A warning pops up if user enters a value lesser than this.
Use Viewer Size: Generates each image to full screen size.
White Background: Use a white background for the images when active or the current background color when deactive.
Report Details:The report can offer a clean looking report. The Header and Footer offer additional information throughout the whole report. Activate and then type in text that will be visible on all pages of the report.
Note: The following pages will always available when creating a report, but are not editable by the user:Component Information: Graphs the 3DCS information for each part, listing how many points, features, tolerances, moves and measures each part has. Tree Structure: Displays the assembly tree structure of the model. Action Tree: Lists each part's and assembly's moves, tolerances, and measures with a link to each feature within the report. Spec Study: The Spec Study page will automatically be generated when Spec Studies are available in the model. The Spec Study page is available in HTML and Power Point Reports.
|