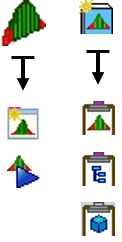
The following steps will lead you through several functions of the Statistical Analysis toolbar. We will look at the two types of analyses: Monte Carlo Simulation and Contributor Analysis. The Statistical Analysis toolbar contains the following icons:

•Click ![]() Nominal Build.
Nominal Build.
•Click ![]() Run Analysis to open the Run Analysis dialog.
Run Analysis to open the Run Analysis dialog.
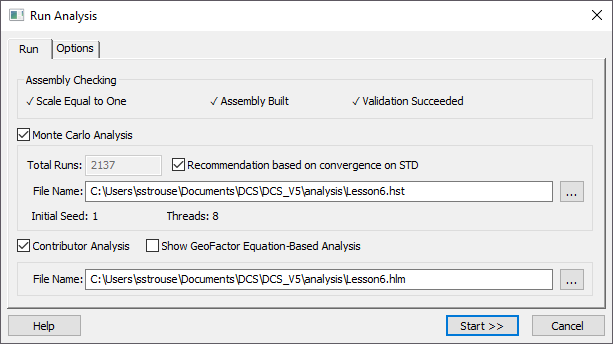
•Verify the Monte Carlo Analysis and Contributor Analysis are enabled by checking the box next to each if not already checked.
Monte Carlo Simulation will generate the histogram and statistics based on simulated builds of the model. Contributor Analysis determines which Tolerances in the model have the greatest contribution to a measured output.
•Ensure the Recommendation based on convergence on STD checkbox is activated.
•Ensure the box next to Show GeoFactor Analysis is unchecked.
The Run Analysis dialog should look similar to the image below.

•Click [Start>>] to run both analyses. If there is a warning that the results will be overwritten, click [Yes] to overwrite the old analyses.
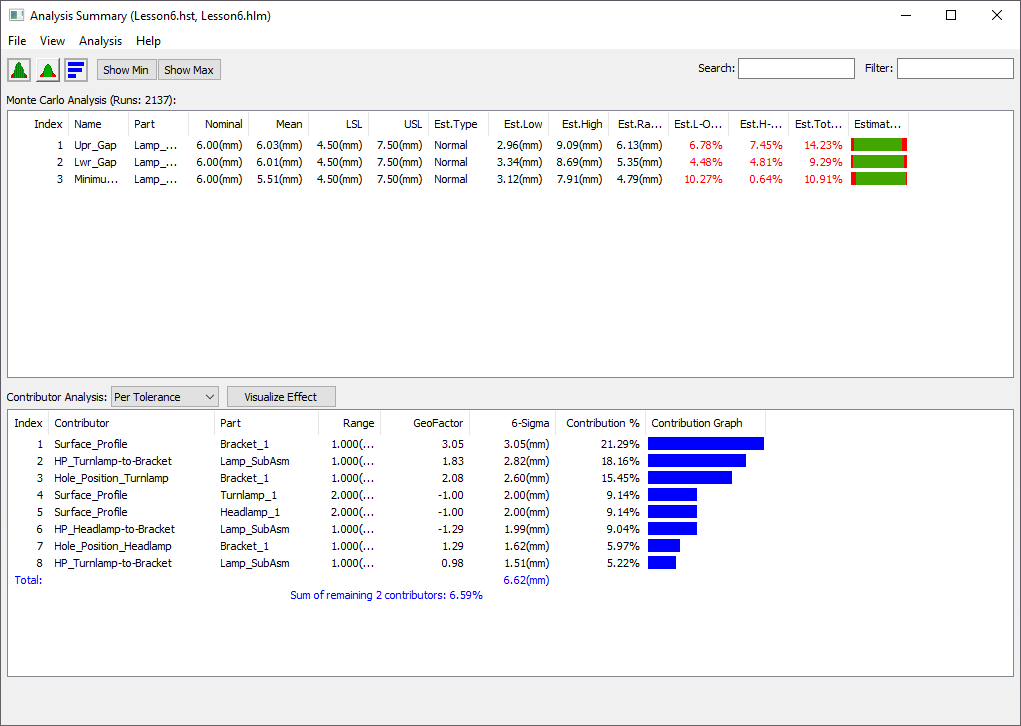
When the analyses are finished, the Analysis Summary window will open with the results.

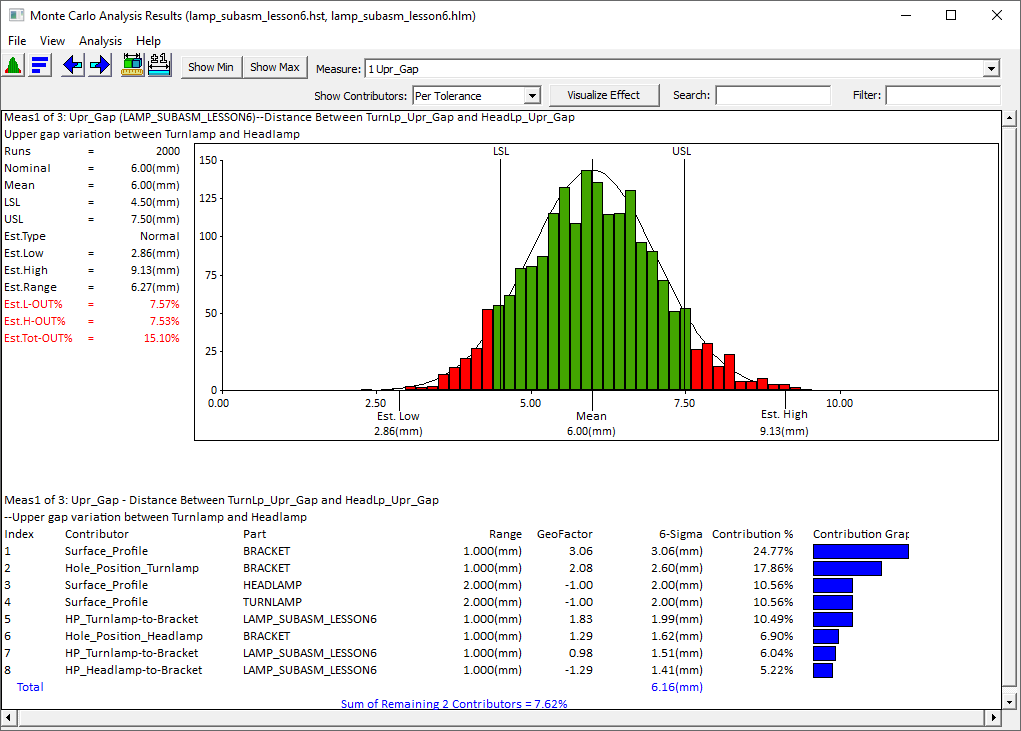
•Double click on Upr_Gap in the Monte Carlo Analysis section to open the Analysis Results window for that measure.

>>> Your results may not match the above illustration <<<
•In the Analysis window, click [View] then click ![]() Options. This will open the Analysis Options dialog.
Options. This will open the Analysis Options dialog.
•In the Monte Carlo tab, click [Defaults]. This will reset the Analysis Summary and Analysis Results windows to display the default statistics.
•In the Contributors tab, click [Defaults]. This will reset the Analysis Summary and Analysis Results windows to the default contributor display.
•Click [OK] in the Analysis Options dialog.
•In the Analysis Results window, select ![]() Previous and
Previous and ![]() Next to view the results for the three Measures of the model. You can also go to a specific measure using the Measure: drop-down list.
Next to view the results for the three Measures of the model. You can also go to a specific measure using the Measure: drop-down list.
•Close the Analysis Summary and Analysis Results windows.