First, you will learn how to use the Contributor Analysis to select a tolerance to adjust to improve the assembly.
•Close Lesson8Lamp_SubAsm_Lesson8Analyst_Tutorial_Lesson8 if it is open.
•Open Lesson6Lamp_SubAsm_Lesson6Analyst_Tutorial_Lesson6. This will be our baseline model.
•With the Analyst_Tutorial_Lesson6 tab open, Go to the North quadrant of the Compass (called My Social and Collaborative Apps) and select the Collaborative Lifecycle app.
•Select the Analyst_Tutorial_Lesson6 Simulation and select ![]() Duplicate from the toolbar at the bottom.
Duplicate from the toolbar at the bottom.
•Right-click on the new duplicated Analyst_Tutorial_Lesson6 Simulation in the model tree and select Properties.
•In the Reference tab of the Properties dialog, change the Title to "Analyst_Tutorial_Lesson9a".
•In the Compass, go to the South Quadrant (called My Content and Simulation Apps) and select 3DCS Variation Analyst V6 in the V+R My Simulation Apps section to return to the 3DCS Variation Analyst workbench.
•Go to File ![]() Save Management.
Save Management.
•Select the Lesson6.CATProduct and select [Save As...].
•In the Save As dialog, rename the Product to "Lesson9a.CATProduct" and click [Save].
•In the Save Management dialog select [OK] to save the CATIA Product under its new name. The model is not actually saved until you click OK.
•Click the ![]() Application Button then select
Application Button then select ![]() Save As.
Save As.
•Change the File Name to "Lesson9a.wtx".
•Click [Save] in the Save As dialog.
•Go to File ![]() Save As.
Save As.
•In the Save a Copy dialog, enter "Lamp_SubAsm_Lesson9a" and make sure the Type is set to [Assembly (*.asm)]. Click [OK].
•In the Assembly Save a Copy dialog, click [Save Copy and Open].
•Close the 3DCS Model Navigator and Creo window for Lamp_SubAsm_Lesson6.
•Click ![]() Update Model in the new window for Lamp_SubAsm_Lesson9a.
Update Model in the new window for Lamp_SubAsm_Lesson9a.
•Go to File ![]() Save As.
Save As.
•In the Save As dialog, enter "Lamp_SubAsm_Lesson9a" as the new File name and make sure the type is set to [Part Files (*.prt)].
•Click [OK] to save the model and close the Save As dialog.
•Click ![]() Update Model.
Update Model.
•Go to File ![]() Save As.
Save As.
•In the Save as dialog, enter "Lamp_SubAsm_Lesson9a" for the File Name, make sure the Type is set to Assembly.
•Click [Save] to save the model and close the Save As dialog.
•Click ![]() Update Model.
Update Model.
•Select ![]() Nominal Build then
Nominal Build then ![]() Run Analysis with Recommendation based on convergence on STD enabled.
Run Analysis with Recommendation based on convergence on STD enabled.
•Double-click Upr_Gap to open the Analysis Results window for that measure.
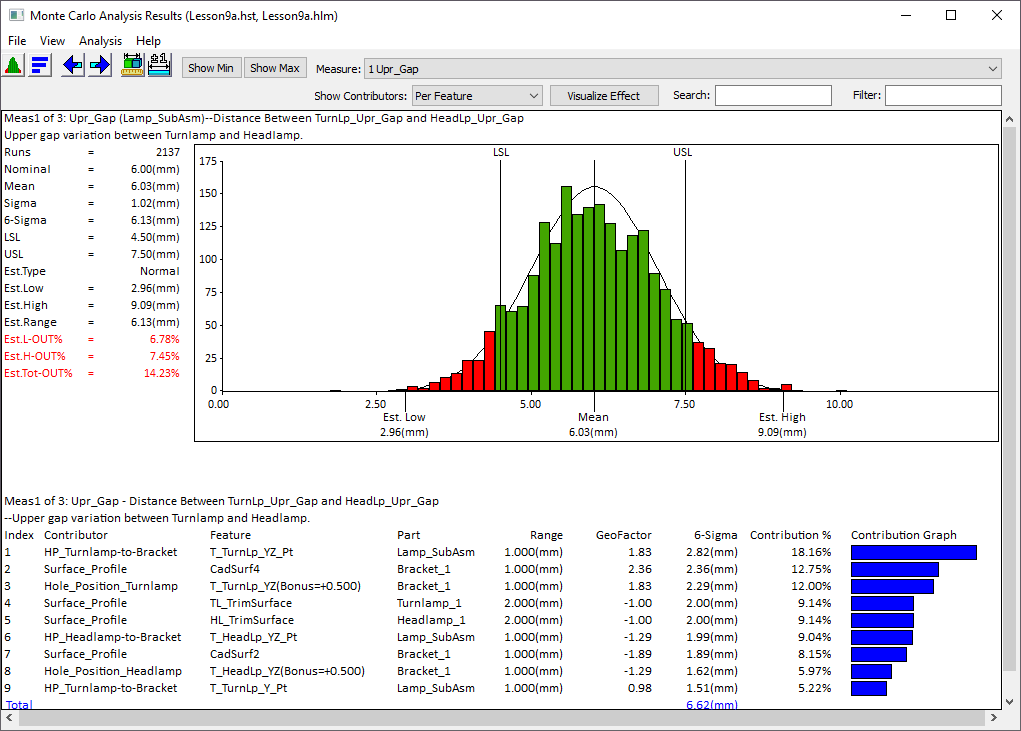
>>> Your results may not match the above illustration <<<
Note the Est. Range and Est.Tot-OUT% values of the Upr_Gap measure. Based on the results, our design currently is not meeting its design requirements. In the Contributor Analysis results notice that the main contributor is the Surface_Profile on the Bracket. We will tighten this tolerance to reduce the variation in the Upr_Gap.
Note: Because this is a major contributor, the detail part process that results in this tolerance should be looked into. This part would be created by a stamped sheet metal process, and the normal expectation from such a process is 1.0 mm. With the addition of a re-strike station in the stamping die, the tolerance could be reduced. Other options such as restricted tolerance (thickness) steel or reworking of the details could also be looked into, to find a way to produce the detail with less variation. Just changing the number on the print will not improve things, a physical change to the plan must be incorporated for this to have meaning. The actual cost of this change will need to be evaluated in order to decide if it is the correct action to take.
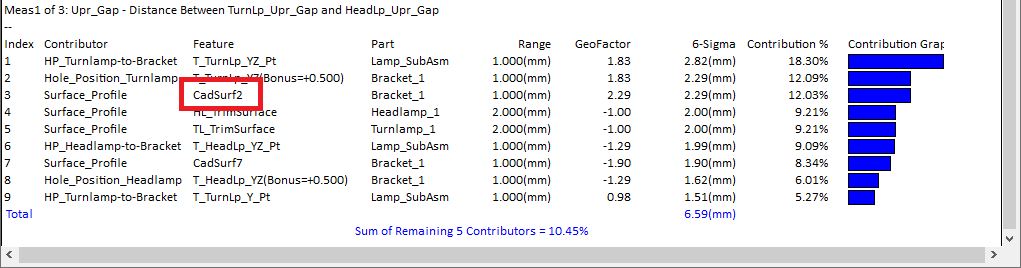
•Change Show Contributors to Per Feature if it is not already.
•Note which CadSurf is expressed as the top contributor for the Surface_Profile tolerance (it should be one of the top contributors and the CadSurf number may not match the image below).
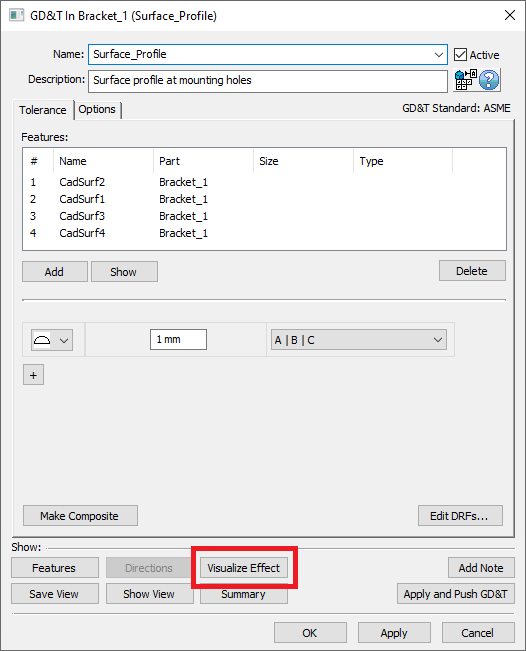
•Double-click on Surface_Profile in Bracket in the Analysis Results window.
•In the GD&T dialog for Surface_Profile select the [Visualize Effect] button.
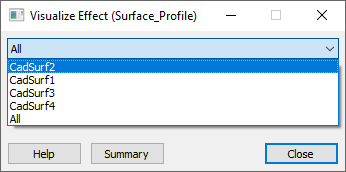
This will open up the Visualize Effect dialog. The Visualize Effect tool is intended to help users understand the effect that a single tolerance has on a model. Deviate is a good tool to see all of the tolerances in the model effecting it simultaneously, but it can be challenging to see what the individual effect is from just one of the tolerances. With Visualize Effect, it is simple to isolate one tolerance and view how its range is effecting the geometry of the model.
•In the Visualize Effect dialog, select the CadSurf from the drop-down list that was the top contributor for Surface_Profile in the results above. It may not match the CadSurf number below.
•Select [One Step] to deviate the surface to its "high" position within the profile tolerance range. In this case, because it is a range of 1.0 mm, the surface will be moved to +0.5 mm. Notice the effect this has on the location of the Turnlamp and Headlamp.
The feature that is deviating should line up with the face shown below on Bracket.
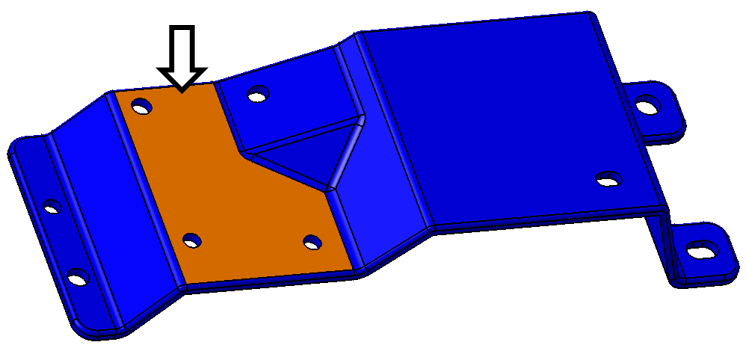
•Select [One Step] again to deviate the surface to its "low" position. This will be -0.5 mm in this case.
•Select [One Step] once more to deviate the surface back to its nominal position.
•Select [Continuous] to have 3DCS automatically step through the three steps above repeatedly.
When running the analysis or performing the Deviate function, 3DCS is randomly setting the variation at each of these faces based on the range input and the chosen distribution. Visualize Effect is not a random location based on the range and therefore is obviously not a visualization of how the simulation is actually running, but rather an additional tool used to gain more insight in the Contributor Analysis results. Visualize Effect can be used with any GD&T dialog as well as any float in the model. It obviously must function slightly differently for a 2D tolerance or float (such as Position or Hole-Pin Floating) than for a 1D tolerance (such as Profile or Slot-Pin floating). For additional information, consult the Help Manual section for Visualize Effect.
•Select [Stop] in the Visualize Effect dialog then [Close] to exit the dialog and the GD&T dialog will reopen.
•In the GD&T dialog change the range from 1.0 mm to 0.5 mm.
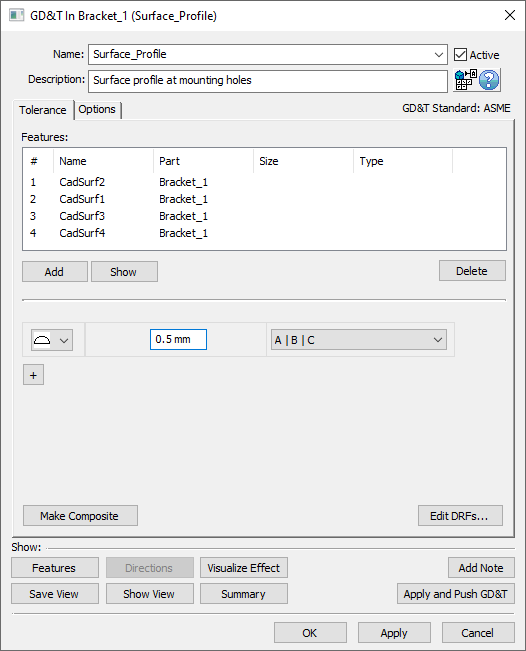
•Select [OK].
•Select ![]() Nominal Build then
Nominal Build then ![]() Run Analysis with Recommendation based on convergence on STD enabled again.
Run Analysis with Recommendation based on convergence on STD enabled again.
•Compare the new Est. Range range of the Upr_Gap measure to the baseline results.
Before |
After |
|
Nominal |
6.00 mm |
6.00 mm |
6STD |
6.05 mm |
5.53 mm |
Your results may not match the above table
Note: The costs of this change would include a potentially more expensive die or a piece price increase. If the decision is made before the die is built the cost would not be as high as if after the die is completed, but there would still be a cost.
•Click ![]() Separate.
Separate.
•Save the model.
•Close the model.