Visualize Effect is a tool that allows users to graphically see the impact of a single tolerance or float in the model.
One input at a time is deviated to high, median, and low sequentially in the model. When the model is in its built position this represents a graphical visualization of how individual tolerances or floats translate through the model. It is meant as a tool for the user to better understand the contribution of a specific tolerance or float that they may be surprised to see (or not see) in the results provided by the Contributor Analysis.
|
Visualize Effect dialog
The Visualize Effect dialog as well as its features and function are shown below:

Feature Select Dropdown: The Feature Select Dropdown allows the user to select which feature to visualize the effect of. The dropdown list will include every feature or float in the GD&T, Tolerance, or Move dialog that the Visualize Effect tool was triggered from. There is also an All option which will sequentially display the effect of every feature or float in the list.
Note: For grouped GD&T or Tolerances, the only option in the dropdown menu will be All and the GD&T or Tolerance will be applied to all of the features together.
[One Step]: Selecting [One Step] will apply a single step in the Visualize Effect process described in the Visualize Effect Process sections.
[Continuous]: Selecting [Continuous] will continuously cycle through the steps in the Visualize Effect process described in the Visualize Effect Process sections. The Delay slider controls the speed of the deviations when using Visualize Effect in its continuous mode.
[Stop]: When Visualize Effect is in its continuous mode, the [Stop] button will become active. Select [Stop] to end the continuous deviations from Visualize Effect.
[Help]: Selecting [Help] opens the Help file to the Visualize Effect section.
[Summary]: Selecting [Summary] opens the summary text file for the Visualize Effect dialog that is open.
[Close]: Selecting [Close] will close the Visualize Effect dialog. Upon closing the Visualize Effect dialog the GD&T, Tolerance, or Move dialog that Visualize Effect was called from will reappear. If Visualize Effect was called from the Analysis Summary window, then the Visualize Effect dialog will simply close.
Accessing Visualize Effect: GD&T Dialog
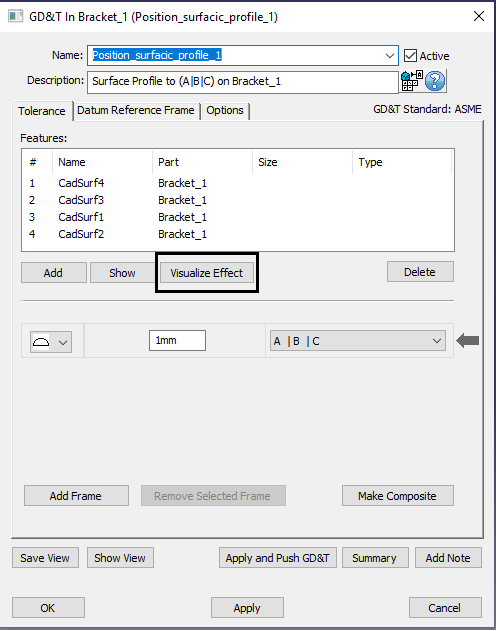
The Visualize Effect tool is available from all GD&T dialogs by selecting [Visualize Effect] below the Features list.
After selecting [Visualize Effect], the GD&T dialog will become hidden and the Visualize Effect dialog will appear.
Accessing Visualize Effect: Moves Dialog
The Visualize Effect tool is available from all Move dialogs by selecting [Visualize Effect] next to the [Options] button.
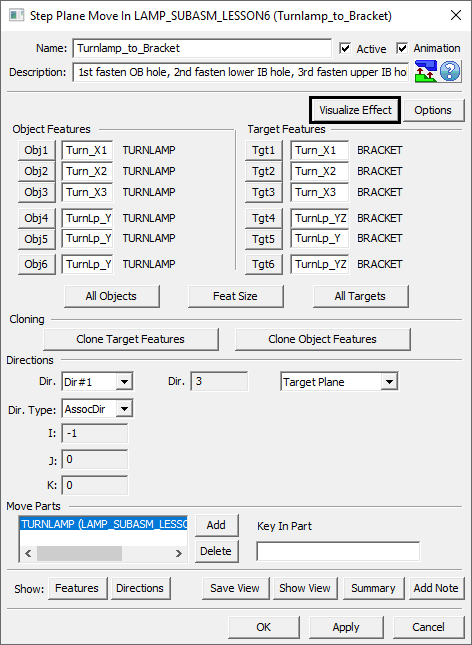
After selecting [Visualize Effect], the Move dialog will become hidden and the Visualize Effect dialog will appear.
Accessing Visualize Effect: Tolerance Dialog
The Visualize Effect tool is also available from the Linear Tolerance dialog and Circular Tolerance dialog by selecting [Visualize Effect] under the Features list on the left hand side.
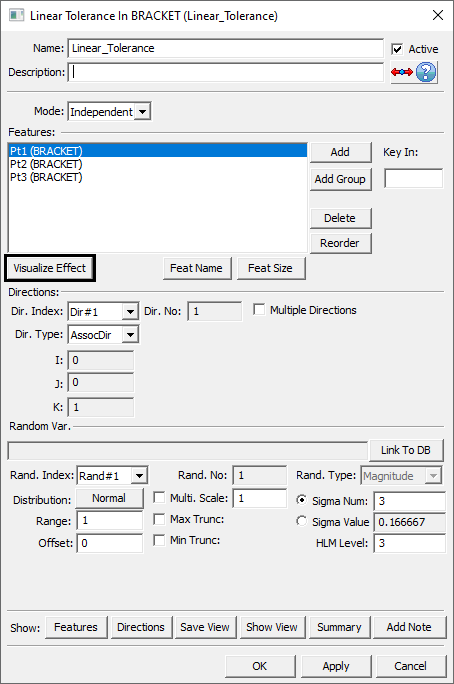
After selecting [Visualize Effect], the Tolerance dialog will become hidden and the Visualize Effect dialog will appear.
Accessing Visualize Effect: Analysis Summary Window
The Visualize Effect tool is also available from the Contributor Analysis list in the Analysis Summary window.
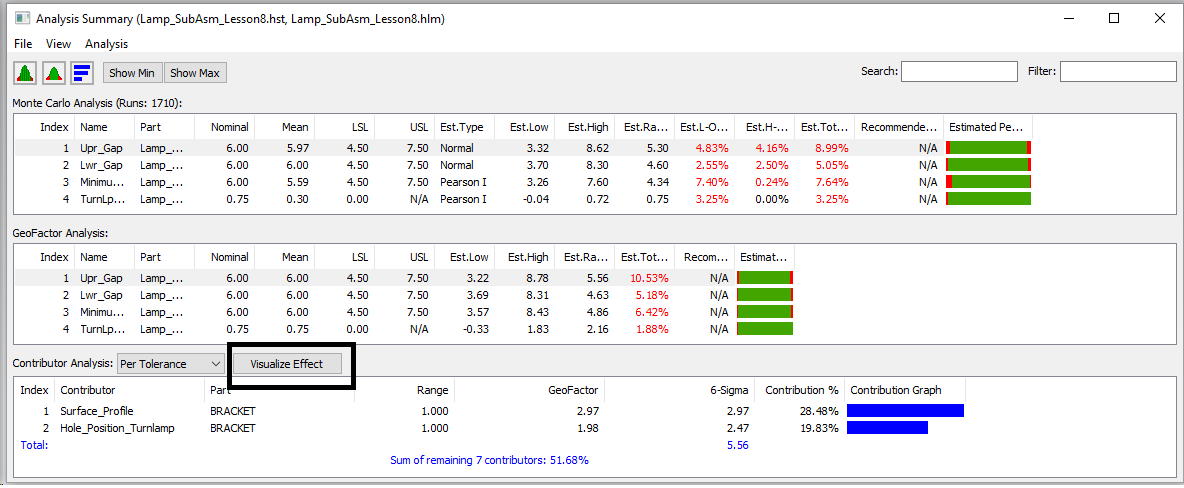
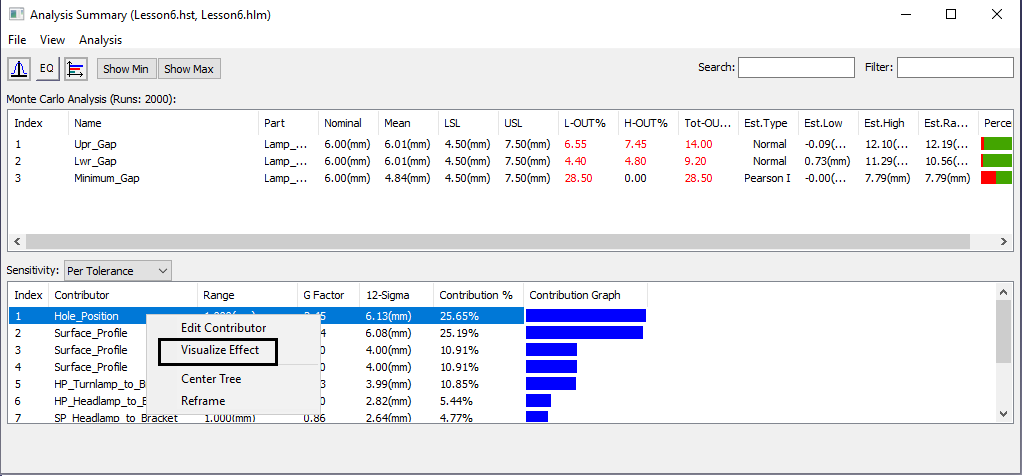
After selecting Visualize Effect, the Analysis Summary window will remain open and the Visualize Effect dialog will appear in front of it.
Visualize Effect Process: Profile Tolerance
For a Profile or Linear tolerance, this tool will deviate each feature (one at a time) to high position, then low position, then back to the median position. This process is the same process 3DCS has used in the past for HLM Contributor Analysis.
The steps of the Visualize Effect tool on a Profile or Linear tolerance are shown in the figure below:
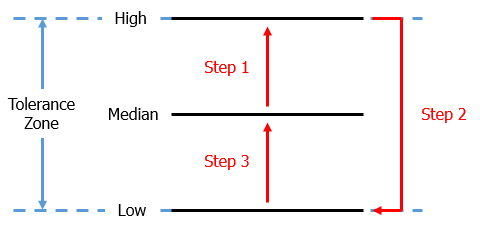
When the model is in its Nominally Built position then the parts in the model that would be affected from this feature deviating will also move.
Visualize Effect Process: Position Tolerance
For a Position or Circular tolerance, this tool will deviate each feature (one at a time) to six positions, hitting four locations around the circle (separated by 90°) as well as hitting the middle location twice. The middle is hit twice so that each direction of the Position or Circular tolerance can be isolated.
The steps of the Visualize Effect tool on a Position or Circular tolerance are shown in the figure below:
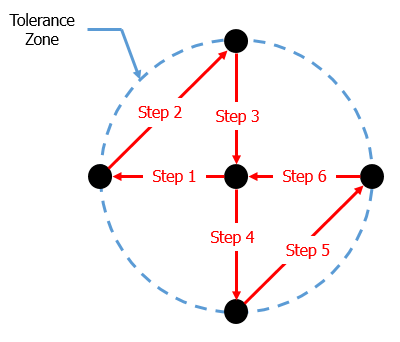
When the model is in its Nominally Built position then the parts in the model that would be affected from this feature deviating will also move.
Visualize Effect Process: Floats
Visualize Effect can also show variation coming from Hole-Pin or Slot-Pin float. The pin is always either centered in the hole/slot or the OD of the pin is touching on a wall of the hole/slot.
For Hole-Pin float, the effect is graphically shown using the same process that is used for Position tolerances in the Position Tolerance section above. The figure below shows the process for a very small pin floating in a large hole:
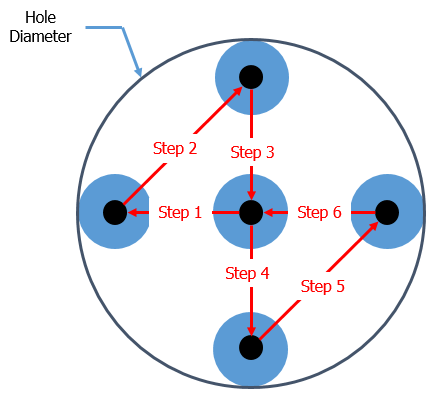
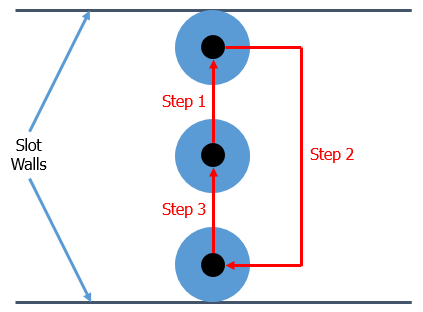
For Slot-Pin float, the effect is graphically shown using the same process that is used for Profile tolerances in the Profile Tolerance section above. The figure below shows the process for a very small pin floating in a large slot:
The model must be in its Nominally Built state for the floats to display any effect.
