Color Contour Lines offer a visual representation of all active measurements. Once a simulation is run, lines appear at the location of the measurements and show statistical outputs such as % Out of spec, 'N'STD, Ppk, and Est Range. The lines are shown in the direction of the measurement and are given a length and color based on the statistic type values. This allows the user to locate critical measures and perform root cause analysis. It is also possible to run multiple data sets and compare the lines or measurements using the statistical data.
|
After running a simulation, color map lines can be activated via the ![]() Hide/Show Color Contour Lines in the 3DCS Display toolbar.
Hide/Show Color Contour Lines in the 3DCS Display toolbar.
Procedure:
1.Click ![]() Nominal Build.
Nominal Build.
2.Click ![]() Run Analysis.
Run Analysis.
3.After the simulation is finished, click ![]() Hide/Show Color Map Lines in the DCS Display toolbar.
Hide/Show Color Map Lines in the DCS Display toolbar.
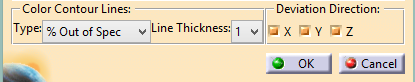
4.Click on ![]() Color Contour Options to select settings for lines.
Color Contour Options to select settings for lines.
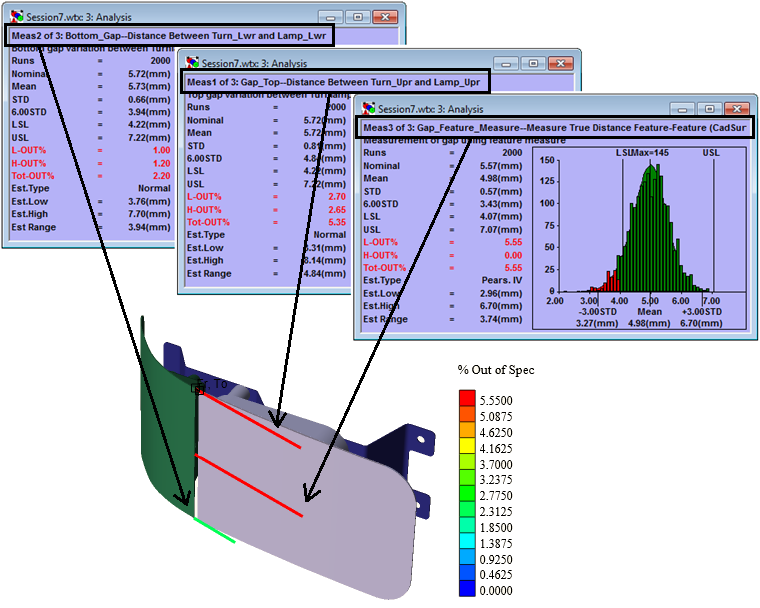
5.Set the Type to % Out of Spec and Line Thickness to 4. Below is an image of the measures corresponding to these settings.
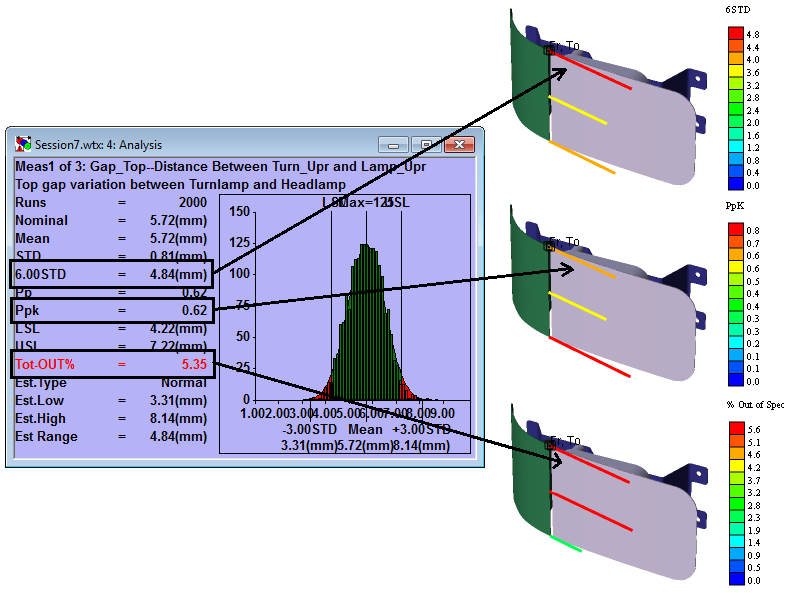
6. From the Simulation section, choose %Out of Spec, 'N'STD, Ppk, or Estimated Range.
For example: Meas1 is the gap at top between the turnlamp and headlamp. This measure is the most critical if focusing on 6-Sigma. However it is significant but not the most critical when looking at % Out of Spec statistic.
To see color map lines with shading, enable the ![]() Hide/Show Color Map Shading icon. This will color shade the areas at the location of the lines. The shading will reflect the color of the lines.
Hide/Show Color Map Shading icon. This will color shade the areas at the location of the lines. The shading will reflect the color of the lines.
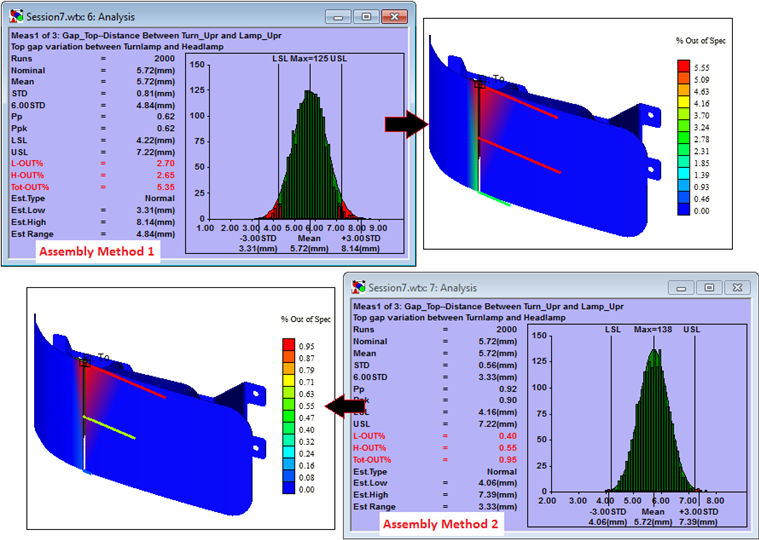
Multiple simulations can be opened to view the lines of each and compared with one another. Alternate between simulations and the color map lines associated to it will automatically update.
Type:
% Out of Spec: Show based on % out of spec values from selected simulation window.
'N'STD: Show based on 'N' STD values from selected simulation window. The sigma number 'N' is defined in the simulation options.
Ppk: Show based on ppk values from selected simulation window.
Estimated Range: Show based on Estimated range values from selected simulation window.
Note: Angle measures for n-Sigma will not be shown if any length measures exist. However, they will still be used for n-Sigma if no length measures exist. Angle measures are used for % Out of Spec & Ppk & Est Range.
Line Thickness: Adjusts the width of the Contour lines.
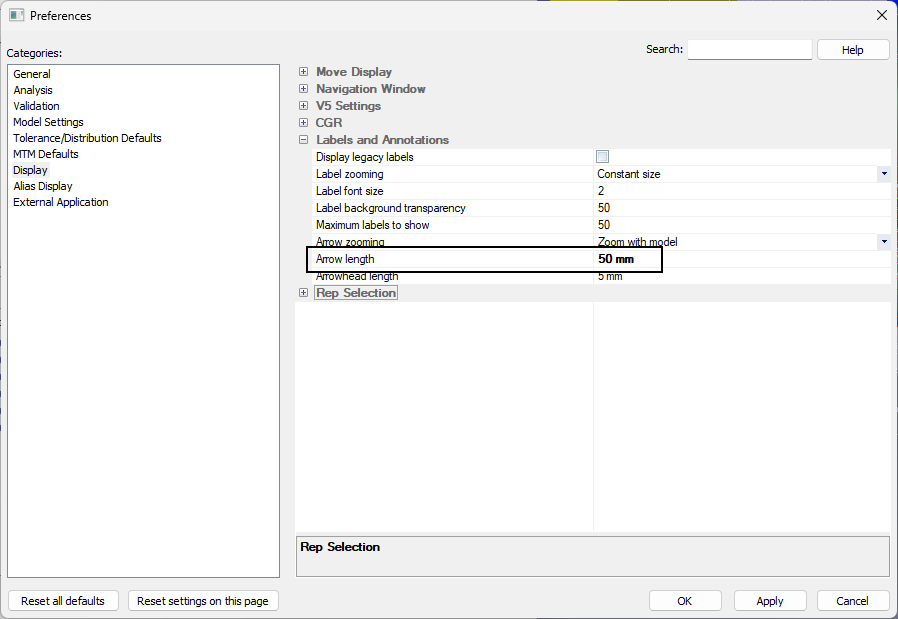
Use the Line Thickness option to set the thickness of the lines. A value of 1 is the thinnest while a value of 10 is thickest. For Line Length setting go to ![]() Preferences
Preferences ![]() Display.
Display.
Activating any or all of the directions allows the Color Contour to deviate along the measurement's specified direction.
•Measurements that have no specified direction will use the first point's associated direction, if exists.
•If multiple directions are used in the measurement (e.g. Two Point List), the first direction will be used for Color Contour deviation.
•Measurements without location (e.g. Combination Measure) are not supported.