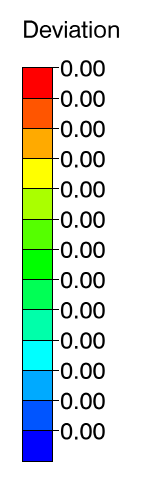
The Legend in Color Contour is the list of best to worst deviations. The Legend is detailed with Red - displaying the positive variation results; and Blue - displaying the negative results. To show the Legend, go to the Color Contour Options page
|
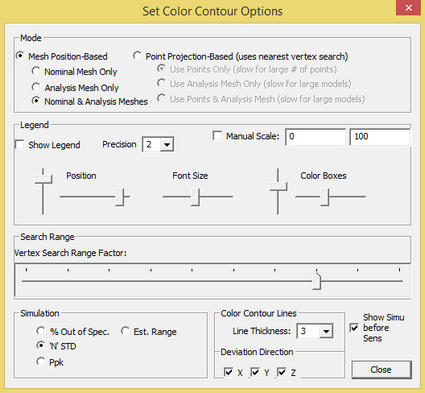
Show: Turns the legend on or off in the graphic window.
Precision: Sets the trailing zeros to be shown in the Legend. (Example: 2 = 0.00)
Manual Scale: Will set user defined values in the Legend and shown Color Contour for parts. In the display, the defaults are set as 0 (min) and 100 (max).
Position: Adjusts the position of the legend. Move the legend sliders horizontally or virtically with the respective sliders.
If the legend does not show when activated, adjust the horizontal or the vertical slider to the opposite sides. The default is not automatically adjusted to the Graph window or the screen resolution.
|
Font Size: Adjusts the font size in legend. Move bar to left for smaller font size and right for larger font size.
Color Boxes: Adjusts the sizes of the color boxes in legend. The first setting increases size vertically. The second setting increases size horizontally.
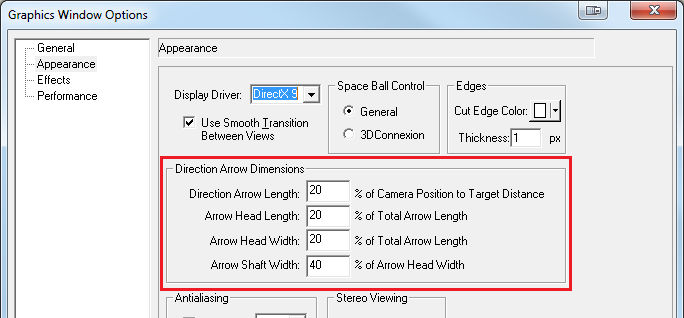
See also:Display Options to specify Color Contour Line's length.
|