This function contains extra functions that can be used and provide results to the user. This function can be reached by opening the
|
![]() BiModal Simulation Analysis (dcsSimuBiModal)
BiModal Simulation Analysis (dcsSimuBiModal)
This function provides the results for worst-case variation in a model. To find the worst case build for a particular measure, 3DCS will randomly deviate the tolerances with Modal distributions. So, more runs increases the probability of finding the worst case. For example, imagine a measure that is at its maximum result when four linear tolerances are at their maximum, two other linear tolerances are at their minimum, and a circular tolerance is deviated at a 45 degree angle. If the Worst Case DLL Factor Levels are set to 2 and 9, then there are 576 different possible builds. Each simulation run has a 575/576 chance of not resulting in the maximum measure. Therefore, 2650 simulations must be run to be 99% certain the maximum measure result was found.
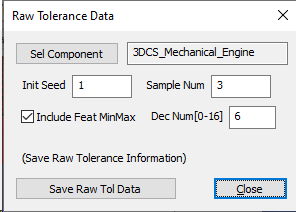
Total Runs: The total number of samples for simulation. Initial Seed: The starting seed for simulation. MAG Factor Level: The Modal distribution level in Magnitude Random Settings for all tolerances, GD&T, and floats in the model. A value of 2 is recommended. ANG Factor Level: The Modal distribution level in Angle Random Settings for all tolerances, GD&T, and floats in the model. Values of 5 or 9 are recommended. Run at Component: Allows the user to run the analysis on a sub-assembly or individual part. File Name: Allows the user to set the name and location of the simulation results. Set Model with Worst-Case Settings: will set the model to the setting used in the worst case analysis. This function is not reversible. All tolerances, GD&T and floats are set to Modal distribution unless they were set to Bi Mode or Constant distribution. This includes floats used to added Datum Shift variation. HLM levels will be set to the levels displayed in worst case dialog (Mag Factor Level and Ang Factor Level). The GD&T deviation method will be set to Range Control. The user does not need to click the Set Model with Worst-Case Settings button in order to run the worst case simulation results. This button is available for the user to save a copy of the model for use with Analysis Batch Mode or for reference. It is recommended to create a copy of the model prior to using worst case analysis to avoid accidentally overwriting the original model. Reset Datum Ang Ran: Sets the Angle distribution for datum shift contributors to Uniform. For use on models that have been set to Modal with the Set Model with Worst-Case Settings button. Raw Tol Data: This function will run a Monte Carlo Simulation and create a text file that will report all tolerance values, before and after the tolerance is applied, and what affects they have on the measures.
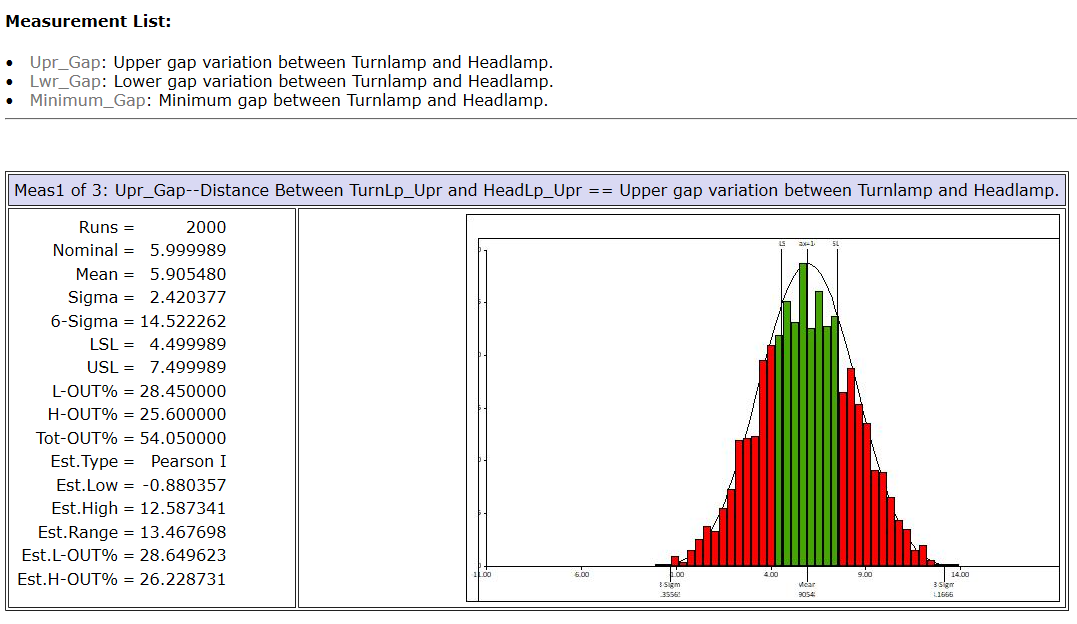
Start >>: Will start the simulation. After successfully finishing the simulation, the results are saved in an .hst file and can also be shown in an HTML page. The most important results for worst case analysis are Min, Max, and Range.
|
|||||||||
|---|---|---|---|---|---|---|---|---|---|
![]() Model Information (dcsModelInfo)
Model Information (dcsModelInfo)
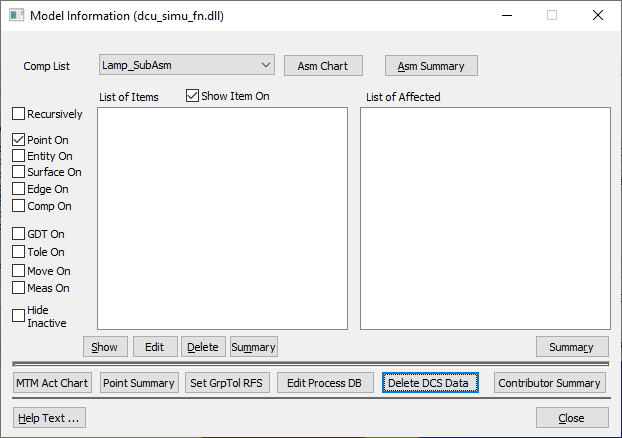
This tool is very useful in validating model inputs: points, moves, tolerances, measures. It displays information for each of the checked items in the left column. Steps: 1.Select a Component from the drop-down. 2.Select an item on the left column: Point, Entity, Surface, Edge, Component, GD&T, Tolerance, Move, Measure, Hide Inactive. 3.Select one of the features listed in the left window named List of Items. 4.Read information in the right window named List of Affected, for the selected item.
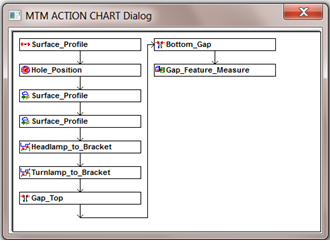
•Component List: displays the selected component (from the drop-down) for which the information will be displayed. •Recursively: shows the information for all children of the selected component. •MTM Action Chart: Shows the order of moves, tolerances, GD&T, measures are executed in the model.
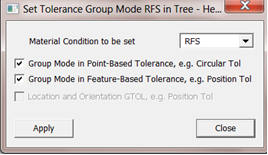
•Point Summary shows the number of points in each part of the selected assembly with their Type In and Screen Position and vectors. The points names are not listed. •Set Grp Tol RFS allows setting circular tolerances to Group mode for the selected assembly. Also in the same dialog the user can set all circular tolerances to either MMC, LMC, or RFS (default).
•Edit Process DB allows editing parameters for the Process Capability Database (Legacy). •Delete DCS Data will remove all DCS data (points, features, MTMs) from the model, leaving only the geometry. |
|---|
![]() Classic Geofactor Analysis (dcsRunGeoFactorClassic)
Classic Geofactor Analysis (dcsRunGeoFactorClassic)
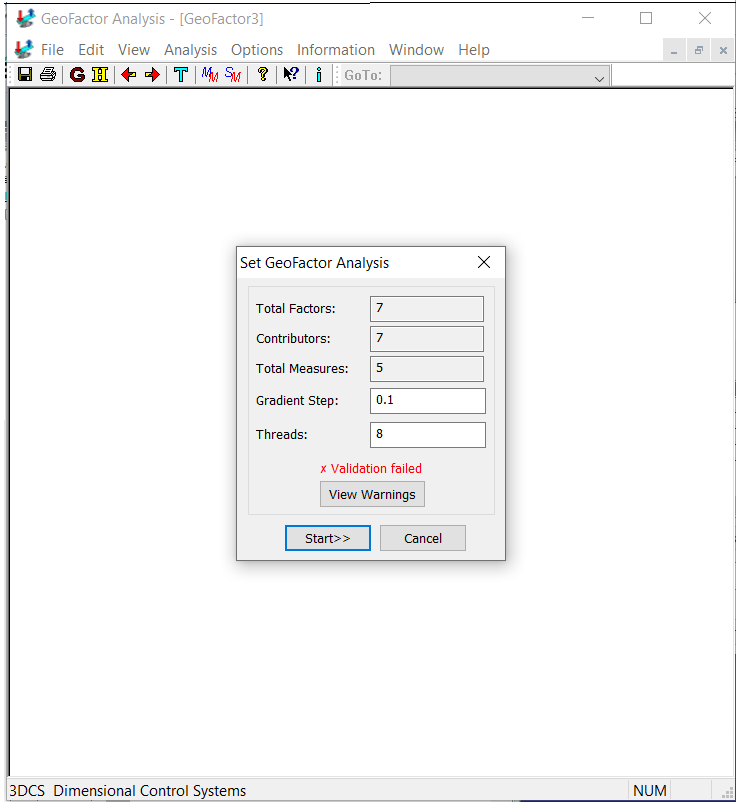
This function will launches the classic GeaFactor Analysis window and run the Analysis using the classic algorithm. |
|---|
![]() One Page Report (dcsOnePageReport)
One Page Report (dcsOnePageReport)
This function provides the 3DCS model outputs using the One Page Report format. The user should run the Simulation, Sensitivity and/or Geofactor Analysis before generating a One Page report.
|
|---|
![]() Automatic Feature Point Creation (dcsAutoFeatPtCreation)
Automatic Feature Point Creation (dcsAutoFeatPtCreation)
Automatic Feature Point Creation routine purpose is to replace the manual creation of feature points needed in a 3DCS model. A very large number of points can be automatically created in a very short time, thus speeding up the model creation process. In general points creation can take some time, depending on how many assembly operations or measurements are needed in the model. Given an initial set of points, the routine will identify surfaces within the set distance (Minimum Gap Distance) and create feature points as projections of the initial point onto these surfaces (features). Note: The surfaces onto which the points will be projected should have a DCS mesh already created, otherwise points will not be projected. If a set of opposite surfaces are not touching (meaning that there is a gap present between the parts), a dynamic point will be created for one of the gap points onto the opposite part. The dynamic point is available to be used in assembly operations (moves) instead of the initially created point. The reason for this substitution is to avoid shifting the parts if there is a design gap (sometimes parts are designed with a gap that will be filled with glue during assembly).
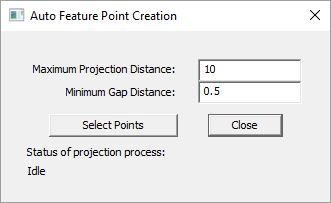
•Maximum Projection Distance: is the farthest a point will be projected onto a feature. This field can be modified by the user. •Minimum Gap Distance: represents the minimum distance measured between two projected points with opposite vectors, to be considered a gap. If the distance between the two points is larger that the displayed value, a dynamic point will be automatically created for the first point in the gap. •Select Points: allows multiple points selection by dragging a window around them. Close the pop-up window when the desired points are selected. •Status of projection process: displays the status of points creation process. In the image below are illustrated the initial and final stages of the automatic points creation process. One Catia point will be used to create points on three parts that have gaps between them. The CATIA point is named Original, so all created points will include that name: •The new created points will have APR (automatic point routine) as a prefix and a unique number identifier as a suffix (e.g. APR_Original_1). •The points that are considered part of a gap will also have a 'G' for first gap point and a 'g' for the second gap point as part of the prefix (e.g. GAPR_Original_2 and gAPR_Original_1). •The dynamic point created from the first gap point will have a 'd' added to the prefix (e.g. dGAPR_Original_2).
|
|---|

