The shading function color codes the level of variation in parts and/or assembly during deviation. For every build, the part or assembly is shaded based on its current position from nominal. In a color map, the maximum variation (critical areas or areas furthest from nominal) are colored red while minimum variation (noncritical areas or areas closer to nominal) are shaded blue.
The requirements to using Color Contour in 3DCS: the user will need to have at least one tolerance or GD&T active, and at least one move. A measurement is required to see the Simulation output with Color Contour.
|
|
In this section: |
TopicsDeviation Direction |
1.Click on the ![]() Hide/Show Color Contour Shading in the 3DCS Display toolbar. To activate Color Contour for parts, use the Edit Part dialog or for all parts and assemblies use the MTM On/Off.
Hide/Show Color Contour Shading in the 3DCS Display toolbar. To activate Color Contour for parts, use the Edit Part dialog or for all parts and assemblies use the MTM On/Off.
2.Click ![]() Nominal Build. Parts will turn blue and the Legend will display on the screen.
Nominal Build. Parts will turn blue and the Legend will display on the screen.
3.Click on ![]() Deviate. The Legend will then show Deviation as the title. Once the user runs a
Deviate. The Legend will then show Deviation as the title. Once the user runs a ![]() Simulation, the Legend's title will then display % Out of Spec.
Simulation, the Legend's title will then display % Out of Spec.
Color Contour Shading: Color maps the solid surface mesh (known as the nominal mesh) based on the difference between their current vertex coordinates and their nominal vertex coordinates.
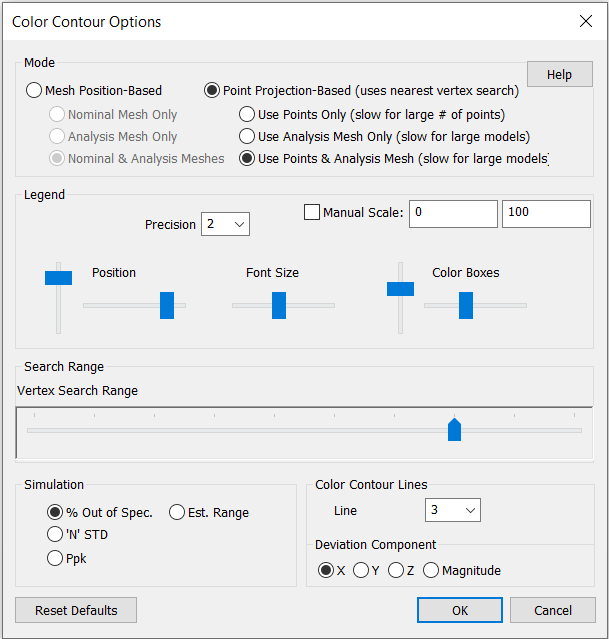
Color Contour Options:
Legend: Show the Legend in the graphics window.
Precision: Changes the displayed number decimal in the Legend.
Manual Scale: Displays all of output configurations between a set value or scale.
Legend scale and location settings:
Position: Changes the position of the legend.
Font Size: Changes the Legend's font size.
Color Contour Box Size: Adjusts the Color Contour box height and width. Left (up and down) adjusts the height of all the boxes; right (left to right slider) changes the width of all the boxes.
Simulation:
% Out of Spec: Shows the entire list of % Out of Spec of all measures.
N'STD: Shows the current N-Sigma from the selected measure. Show the Sigma and 6-Sigma settings in the Monte Carlo Analysis option.
Ppk: Shows the current Ppk from the selected measure. Show the Ppk output in the Monte Carlo Analysis options.
Est. Range: Shows the Estimated Range of the selected measure. Show the Estimated Range within the Simulation window (Monte Carlo Analysis).
Color Contour Lines:
Line Thickness: Adjust the measure line chickness
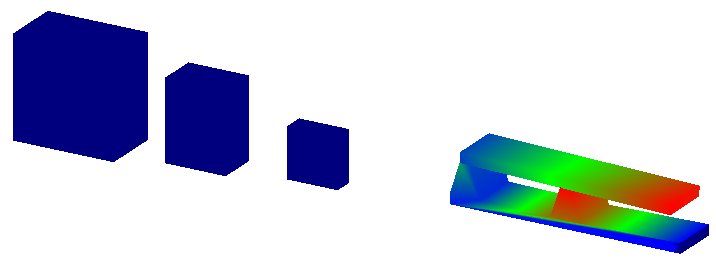
Below is an example with Color Contour during deviation.
In the model, the largest block has feature points with feature tolerance, medium block has feature points and smallest block has a Coordinate Point. Color Contouring shades the nominal mesh based on max deviation from nominal position.
Notes:•Using Materials on parts is a good way to show actual parts geometry to be used in a 3DCS Report. However, Materials prevents Color Contour from showing on the parts. In order to use Color Contour, the user will need to hide the Materials that are applied to the parts. •Color Contour uses all points in a part. If the part has multiple points located outward, this will skew or pull the Color Contour results to that point(s).
|