After a simulation, the measurement data can be saved in text or excel format in a separate file for later use.
For saving the Monte Carlo Analysis or Contributor Analysis results as HTML or JPEG files, please see Report Generation.
Default location: C:\Users\<username>\Documents\DCS\All Platforms\Results
|
Histogram |
|
|---|---|
File Type |
Description |
Histogram (*.HST) |
Saves all the statistical data from the Histogram. |
Statistics Row (*.CSV) |
Saves each measurement's statistical data. |
Statistical Column (*.RSH) |
Saves each measurements statistical data; shown exactly from the Histogram statistical list. |
Raw Data (*.RAW) |
Saves the measurement's Min and Max distance information. |
CMM Deviation (*.DEV) |
Saves the measurement deviation data with X,Y,Z measurement values. |
QDM - DCSDB2 (*.CSV) |
Saves the measurement deviation data with X,Y,Z and i,j,k and Diameter measurement values. This data can be used to import into QDM to create measurement charts. |
Related List (*.REL) |
Saves all the measurements information used in Related List. |
Procedure:
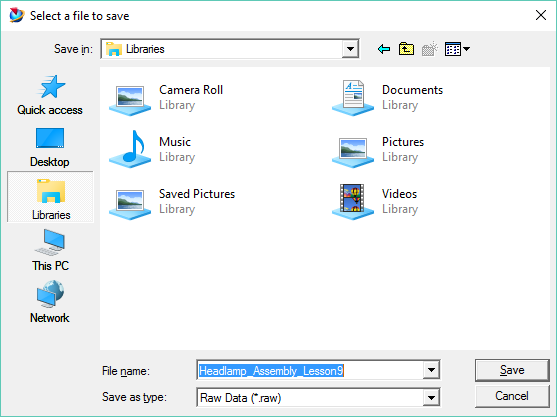
•Switch to a specific measurement to save as Raw Data.
•Click on File ![]() Save Histogram. This activates the Save To dialog box.
Save Histogram. This activates the Save To dialog box.

3DCS incorporates four methods of importing external variation data into the model.
3. If the data contains the part by part deviations of a point along an oblique vector, creating a Linear Tolerance with a user-defined distribution is the most efficient method. The vector specified must be the same as the one used to measure the deviations, and the tolerance should be created relative to the same datums used to measure the parts.
4. If the data contains the mean shift and standard deviation of a point along a oblique vector, creating a Linear Tolerance with a normal distribution is the most efficient method. The vector specified must be the same as the one used to measure the deviations, and the tolerance should be created relative to the same datums used to measure the parts.
If both the deviations and the statistics of a point are known, the user must decide which to use. Using the deviations will preserve any unspecified relationships between points and, if varying the point along multiple vectors, between the vectors at a point. Using the statistical data will allow the variation to be extrapolated to its full range. The simulations will now consider builds throughout the range and thus have more predictive results.
|
|---|
Note:3DCS requires the file to be saved as with the ANSI Encoding selected. If any other encoding is active, the file will not be converted correctly into 3DCS.
|